


Our Ally Financial Investment (NYSE: ALLY)
Not your grandma's typical bank.

Happy weekend again! It’s nice, but winter is coming, so get out there!
(This post might get truncated by your email provider. If so, there should be a link at the end to continue. If not, head to our site and it’ll be front and center.)
This is our first full write-up for you. It’s a ~1 hour read (plus thinking). I hope you find it engaging and come away with two things:
Lots of new insight and context about Ally and the banking industry in only an hour (the “information density” in my memos is pretty high; it’s a month of work and years of accumulated knowledge in a few pages).
A clear picture of why I own the stock, the ways I’d be right/wrong and why I like the idea in our portfolio, even in spite of a likely, looming recession.
First, I have two short notes on our newsletter and on the investment process.
Newsletter Housekeeping
Thanks so much for your ongoing support!
We’ve hit our first 50 subscribers, and our engagement is good. So is the feedback. Thank you, you’re all awesome! If you’re enjoying our work, please take a minute to think of a friend who might enjoy, and share. We spread by word of mouth!
Again, this is about you, so thank you for everything and for your support. Starting something from nothing is scary. The little pessimist in my brain (and everyone’s brain) has asked many times: what are you doing, Chris? Then you guys remind me what I’m doing, why, the value of it, and why it’s a cool thing to do.
The next few posts: we’ll cover another company down the line, most likely Brookfield. I’m also researching a new idea not in last week’s intro to our portfolio. These will take time because I have quarterly earnings starting mid-October. I’ll write about earnings and what’s going on in our businesses though, and about how I parse new information they report to us.
If you’re not subscribed to the distribution, you won’t receive notifications when that stuff comes up, so be sure to subscribe free by slapping this button:
A Little on the Research Process
Researching a business can be difficult and frustrating. Net-net, it’s fun for me. There are two things I like about the money game:
The volume of learning you do while looking for differentiated insights, and
The fact you get to take real actions on the good insights.
It’s rewarding when the pieces come together and when you turn out to be right. (It’s less rewarding when you’re wrong, but you’ve got to move on and remember it isn’t about being right 100% of the time. It’s a game of averages.)
If I didn’t have 10 years’ investing experience and 5 years following the banking industry, I might have become stuck working on Ally and possibly fallen into the pitfall of buying “just because” — such as to justify all the work I did.1
The Fed’s FRED database, for example, has tons of bank data. It’s got loss rates on many bank loans… except automotive (“auto”) loans, which is most of Ally’s business.2 Auto is often a small part of competitors’ books, too, so they don’t usually talk about what’s going on in that sub-segment. Even Ally’s own data is muddied during the financial crisis — exactly when you’d like nice clean loss data — because it was still part of GM as it moved through bankruptcy.
All this meant a lot of digging around and thinking, for example by reconstructing Ally’s loss history. Even then, I needed to make judgments on how loan losses might look in the future because (a) Ally’s loan book, and (b) the US consumer situation are both different today vs. the past. There’s no clear “reference class” of history or competitors to go by. It’s times like this where critical thinking, judgment, and a willingness to make probabilistic bets have the most value, though.
Lastly, as you read, keep in mind what’s here is a collection of facts colored by my approach. We’re also always in the “fog of war”, to to speak. Even Ally’s CEO doesn’t know every detail and certainly can’t predict precisely where it or the industry will be in 5-10 years. We live in a world of odds and probabilities, and of competitors & customers with their own decision-making agency, too. This said, I strive for a solid grasp of the investment and the business’ key drivers. I’ve been told “you do good work” and hope feel the same about it.
Once again, I hope you enjoy the read as much as I enjoyed the write.
Before you dig in, if you haven’t visited our post on how banks work (with some jargon defined), head there first unless you know your stuff.
Ally Financial (NYSE: ALLY)
Full disclosure again: I own shares of ALLY for myself and someone else. We intend to own this business for years if our thesis is working, but we reserve the right to change our mind as information changes or we find better uses of capital! Nothing in here is investment advice.
The Whole Thesis
Attached below is the original report on Ally I wrote in the second quarter this year (“springtime” to normal people). We bought the stock after the US regional banking crisis, though I’d been reading its disclosures for a year and had known about it since 2016. We keep it for reference and update it with notes, changes, appendices, etc. as I learn more, as things change, and as new information comes out. Investing isn’t static, it’s dynamic.
The memo is meant for an investment professional. Below this, though, I re-wrote the idea to appeal to a wider audience while still trying to preserve both detail and the essence of the idea.
There will still be math and thinking involved. What? No! No complaining about math and thinking. Look, you’re the one that signed up for this.
If you like or dislike this dual format, please let me know.
The Easier ALLY Read
Some background…
Ally is the second largest online bank in the US. It began life as General Motors Acceptance Corp. (GMAC) under GM. GMAC was a “captive” auto financing subsidiary. Like Ford Credit or Toyota Financial Services, these exist to increase car sales for their automaker by lending to ensure dealers and consumers have access to plenty of financing options when they buy.
Ally was split off after GM’s ’09 bankruptcy. It then did two things for a decade.
First, it expanded across the auto loan industry: Ally had an exclusivity agreement with GM to ensure continuity of business for both. Ally knew GM would eventually rebuild its own financing arm, though, since it’s more efficient to run incentive/marketing plays this way. Since 2011, Ally’s thus been diversifying away from GM and toward other franchised & non-franchised dealers. It also moved deep into the used vehicle market, where the captive auto financiers don’t play because selling a used car doesn’t help an automaker. Today, almost 70% of the auto loan book is used vehicles.
Ally’s become the US’ largest auto lender alongside Capital One. It mostly sells used vehicles, and mostly to prime and “near prime” quality borrowers.
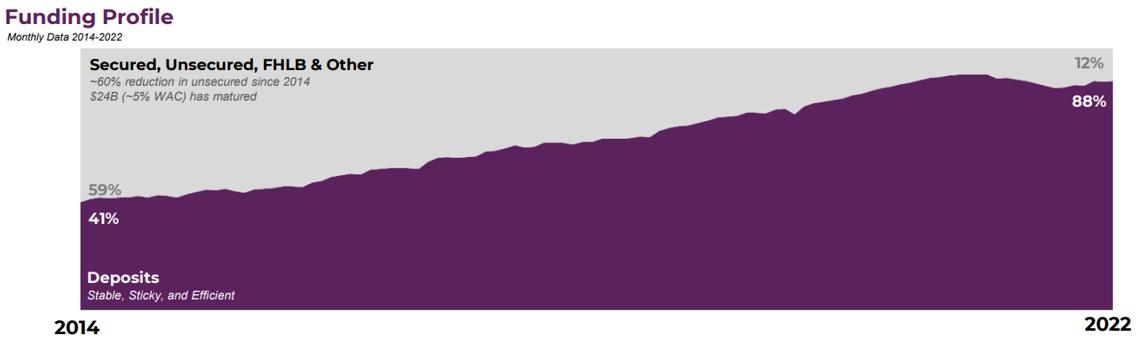
Second, it built a consumer bank: Ally’s management used the existing lending business as a springboard to build a bank. Within GM, Ally had been funded by “wholesale” funding (various kinds of debt from the capital markets), but is now funded by “retail” deposits from individuals looking to grow savings via savings accounts and certificates of deposit (CDs). Today, 85-90% of its funding comes from those retail deposits, up from <35% back in 2011.
You can think of Ally today as near the end of its first phase existence as a stand-alone auto lender and online bank, where the next stage will be stitching together a diversified consumer bank with more checking products, credit card, mortgage, commercial loans, etc. Keep in mind though, that its origin, business model, and industry position make it quite different from most banks.
Summary — Investment Thesis
Our view is that the stock market has oversimplified, short-sighted concerns on Ally and that many of the key risks are more than priced in at ~$27. The market’s clearly ignoring Ally’s long-term potential even if we move through a severe recession. Our differing thesis centers on a few parts of the business model that will perform better than we think is expected.
1) Net interest margins/income (NIM/NII) & securities losses: in 4Q21, management told the market that margins would be strong and called out lower deposit costs. However, the bank is “liability-sensitive”. This causes NIMs to fall when interest rates rise quickly, and falling NIMs are disappointing the market vs. the expectations Ally set out. Ally’s fixed rate, available-for-sale (AFS) securities portfolio3 has also lost ~15% of its value as rates rose, producing ~$16/share of unrealized losses at a time when unrealized losses (mixed with other factors) have taken banks like Silicon Valley Bank off the playing field. Those unrealized losses will “accrete” back to Ally over time, at over $1 per share per year.
2) Auto prices & volumes: most of Ally’s book is car loans. Prices of autos rose sharply during COVID due to a parts shortage, and are now normalizing back down. Car sales volumes also fall in recession. Lower prices and lower volumes means smaller and fewer loans. The market fears this’ll cause the loan book and net interest income (NII) to shrink. There are so many offsetting factors, though, that this is likely to be noise in 2-3 years. E.g., rates on loans are set to rise 2.4 percentage points while deposit costs should rise half that. This plus other factors imply the bank’s NII would increase, even if the overall loan book were smaller. Furthermore, because auto loans are fixed rate loans and deposits are “floating” rate, Ally’s NIM and NII would increase sharply in a recession when central banks lower interest rates. This will help offset higher credit losses. Ally’s NII will increase much more than typically happens at most banks, because Ally has so few floating rate loans on its books, so the company’s in a much better position than average to weather any coming storm.
3) Recession & Net charge-off (NCO) trajectory: the consensus view is we’re going to have a recession and there’s plenty of evidence and supporting history to say that’s a reasonable view. Where we think the market’s wrong, though, is the impact to Ally and what it looks like thereafter. Its earning power is strong: we’d need nearly 4% in net charge-offs4 on its auto book to overcome ~$3.7 billion in pre-provision net revenue (PPNR). In the GFC, the second worst recession since the Great Depression, Ally’s credit losses peaked at ~2.25%. The bank is highly unlikely to eat into its capital base and reserves to survive, which positions it well coming out of recession as loan growth resumes.
We don’t know if/when there will be recession, or how bad, but believe the investment will do fine through anything but a depression.
Longer term, Ally has a huge runway. The business is taking market share yet has only 0.8% today. It’s growing deposits >10% annually, twice as fast as the industry. It has a strong competitive position in auto lending and is parlaying that into stitching together a diversified, online-based consumer bank by buying & building businesses like consumer credit card, mortgage, and commercial lending (just as management parlayed the auto lending business into an online bank). There’s plenty of evidence Ally is a disciplined lender and is strategically well-managed.
Valuation Summary
We’re paying ~5x free cash flow and ~0.85x tangible book value5 (TBV) for this business, which we think’s capable of 12-15% returns on its equity capital (ROE; management’s targeting “15%+”). We peg tangible book value per share at ~$45-55 in 5 years, worth >1.2x given Ally’s 12-15% ROEs, or $54-66 per share value, vs. the $27 recently paid (+100-140%, ~20% rate of return including dividends).
Said in a simpler way, we expect the bank to have ~$16 billion in equity capital in 5 years (through a recession), for which we paid just over $8 billion today. Our more detailed assumptions are in the Valuation section.
Portfolio: we sold WFC/JPM & pulled from other positions to buy ALLY, as we mentioned last week. We’re comfortable with the large holding as our banks are positioned well for recession, are in strong competitive positions, and Ally’s management and business culture are such that staff are strongly disincentivized from making poor decisions when lending and allocating shareholders’ capital.
Tracking our thesis
We track deposits, industry credit conditions, bank capital levels and liquidity, etc. For Ally, we track credit performance, and margins/returns to corroborate that NIMs, etc., are moving how we expect. We track new investments, like Ally’s credit card and discount brokerage businesses and Ally’s success in cross-selling these products across its ~10 million existing customer relationships.
The Auto Lending Industry
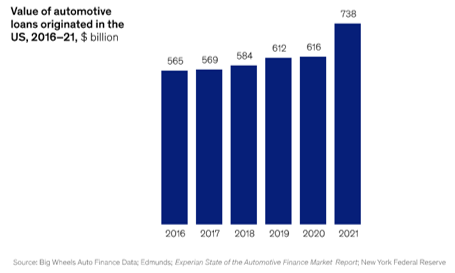
Market: there’s ~$1-5-$1.6 trillion in US consumer auto debt outstanding. In normal conditions, we estimate loan originations (which means “new loans made”) are ~$660 billion each year. Originations today are above trend due to elevated vehicle prices.
Normalizing originations down for this, Ally’s originations would be 10-15% lower (though that assumes management sits still, while there’s levers they can pull, which we’ll discuss in the Business Model section).
This origination rate vs. the market size also means lenders’ loan books turn over in just under 3 years on average. The average loan term is 5-6 years, but many of the borrowers in the loan book will pre-pay, such as when they trade in their vehicles.
Ally originates over $40 billion annually, is ~6% of the market, and is about tied with Capital One as the largest auto lender. ~45% of borrowers have prime or near-prime FICO scores (credit scores), and this is the market Ally focuses on, so it’s ~12% of its preferred market segments.
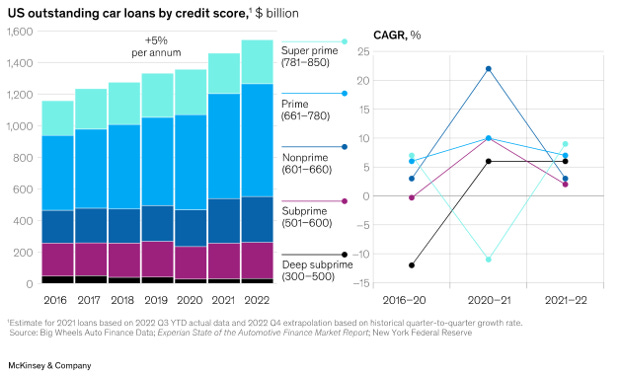
The market’s grown ~5% annually through the recent cycle as shown above, driven by higher vehicle prices and partly offset by lower vehicle unit sales volumes given supply shortages during COVID.

Shown above, annual US new vehicle sales are ~17.5 million units at peak, ~10-12 in a bad trough, and running ~15.5 million currently. New car borrowers usually have better credit (higher FICO scores), and are often sniped off by the captive auto finance companies, or by banks with low cost deposits like JPMorgan Chase (we’ll discuss why later).
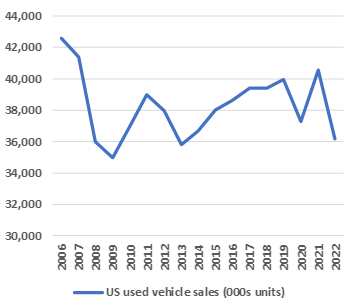
The used vehicle market is larger than the new vehicle market and less cyclical, with sales of ~42 million at peak and ~35 at trough. We’re already sitting at trough sales because of lagged spillover effects from the new vehicle parts shortage during COVID: many dealership used vehicle are 1-3 year old cars. Since there’s been a shortage of cars produced in the last 1-3 years, this means there’s a shortage of 1-3 year old cars for people to buy today. Automakers have worked through the shortage, so the used vehicle market, too, will normalize in the next 3 years. The industry loan origination data we show includes both new and used vehicles. Ally’s auto loan book is ~65% used, 35% new, so Ally’s loan volumes will tend to be less cyclical because it over-indexes to the used car market.
Next, as we said, that 5% growth you see above in the ~$1.6 trillion total auto credit in the system is driven by the (1) value, and (2) number of vehicles on the road:
Pricing: vehicle prices have risen with inflation over time. This implies low single digit growth, ~2%/yr, although it’s reasonable to first normalize prices downward to account for the price spike from the parts shortage, as we described above. We account for this when discussing revenue & profit in the Business Model section.
Vehicle volumes: vehicles in operation (the industry calls the “car parc” or “VIOs”) should grow 0.5-1%/yr in line with the US adult driving population. VIOs grew ~1%/yr from 270 million in 2017 to 285 million in 4Q22. New and used vehicles are financed as the car parc turns over and drivers buy & trade-in vehicles.
An extra tailwind in used vehicles: just under half of used cars aren’t sold through the dealers, and are sold informally (neighbor-to-neighbor), as shown below. This is in decline, though, and those vehicles are moving through the dealership channel instead. Because the dealership is where loans are originated, this’ll continue to add ~1-2% growth to the used vehicle loan market, and Ally will get more opportunities to finance cars.

All in, 3-5% is a reasonable estimate for Ally’s long-term end-market growth in auto lending. If Ally stopped trying to build a diversified bank today and the management sat around doing nothing, the company would still grow at this rate.
Last, our view’s that consumer balance sheets and income statements are in good shape (US consumers are not financially overextended on borrowing, have excess cash, and the labor market is as tight as it has been since data collection began, meaning it’s easy to find a new job). This combined with the normalizing shortage means we think that we’re likely already near the trough, even if a recession occurred. We strongly doubt this will play out anything like 2009 and will look more like 2001.
Distributing and selling car loans:
A substantial majority of auto sales are financed. The lenders tend to lend ~90-125% of the vehicle’s value (e.g., to cover costs related to closing the sale, and because vehicle loans have incredibly low charge-off rates6). Ally averages ~105%. Lower quality borrowers don’t get the great terms that super-prime borrowers do, and the lower end car buyers will be providing down payments.
Even though consumers can shop around and speak to lenders before buying, they don’t. Most auto loans are originated by the dealers at the point of sale, not via advertising or bank branches, etc. Consider: according to Wells Fargo executives, the company maintains relationships with 11,000 auto dealers despite having a dense national branch network.
When a buyer is interested, the dealer’s sales staff will request automated quotes from the lenders after entering information about the buyer and vehicle. The lenders bid competitively. The dealers will often mark-up the winning lender’s bid when presenting the offer to the buyer (I mean, every car buyer knows they’re getting screwed somehow, right?!). The lender may try to negotiate a split, but Ally told us it doesn’t and leaves this value on the table for the dealers.
There are ~18,000 US franchised dealer locations, per NADA. According to Cox Automotive, there are ~60,000 independent used vehicle dealerships. Ally focuses on the franchises and on financially strong used/independent dealers and has 23,000 relationships (franchised + independent + retailers like CarMax), having grown from working only with GM and Chrysler when it was GMAC. Our estimates and discussion with Ally imply that Ally has nearly complete coverage of all the franchised dealers in the US, plus another ~5,000 independents. We don’t need any distribution growth for the investment to win, though.
On the Deposit Side of the Banking Industry
US bank deposits have grown ~5-6%/yr for decades (since data collection began in the 1930s) and through economic cycles. Deposits tend to grow slowly or be flattish late in a recession and into recovery, and growth tends to be high late in the recovery and into an economic expansion.
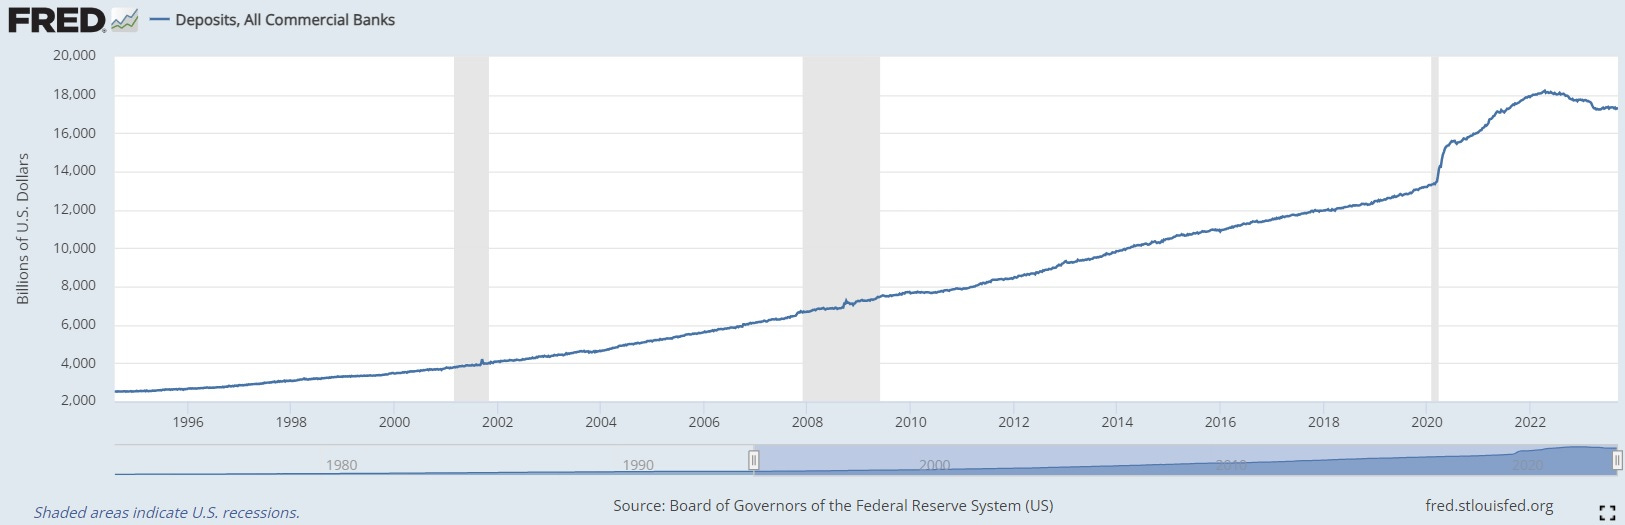
The jump during COVID is from the unusually large fiscal stimulus (such as government checks directly to consumers and small businesses). That, plus corporate borrowing7, supercharged bank deposit growth. That’s now working in reverse and we’re currently in a period of slow deposit growth for 3 reasons:
Spend-down: consumers and smaller businesses are spending down their excess cash as conditions tighten. Until recently, wages weren’t keeping up with high inflation, causing many to eat into their savings, for example.
Shrinking Money Supply and Quantitative Tightening (“QT”): Without going into detail, the Federal Reserve’s QT program is reducing liquidity in the system, which has the effect of slowing deposit growth at banks.
Interest rates: US consumers have easy access to money market funds, which offer higher interest rates than banks do. This is causing excess cash to leave the banking system for the money market complex as consumers and businesses seek higher interest rates, again slowing deposit growth.
Loan growth is also slow today because of tighter financial conditions, and so banks aren’t necessarily in need of deposits, either. According to several banks, many are taking new deposits and simply holding the money as cash8, as there isn’t enough loan demand from high-quality borrowers.
Near term, I estimate the industry’s deposits need to fall another ~7% before returning to trend, which would take 0.5-2 years.
In reality, deposits aren’t falling straight to trend because of two offsetting factors today: there’s still economic growth and there’s inflation. So far, that’s netted out to industry deposits being flattish for the last 6 months. That’s a reasonable guess for the next 12-18 months as well, since our 7% estimate (and estimates from other sources) imply the system is still normalizing before things like nominal GDP again become the dominating factors. I’ll be wrong by a few percentage points up or down, but it should play out something like that.
Deposit share:
There are 4,100 chartered banks and >5,000 credit unions in the US. The top two banks have ~11% share each; the 5th has 2.5%, and it drops off quickly from there. The market’s so fragmented any bank can gather deposits; it’s merely a matter of what you pay to acquire and keep them. Because of its model, Ally can afford to (and does) pay up for deposits.
Higher rates offered are why Ally’s been taking market share. It’s soaking up all the larger accounts, often from younger and upper middle class savers. Think of a software programmer that might have $30K in cash savings but who does most of their banking with Bank of America, whose savings account product is hardly paying anything. They can move to Ally and by my calculation would get 1.5% more on average over the last 5-10 years. Today, it’s more. The incremental interest income on a large account makes it worth it for a consumer to switch, so Ally’s picking up some of that money. It’s even more important today because we’re no longer in a zero-interest-rate world.
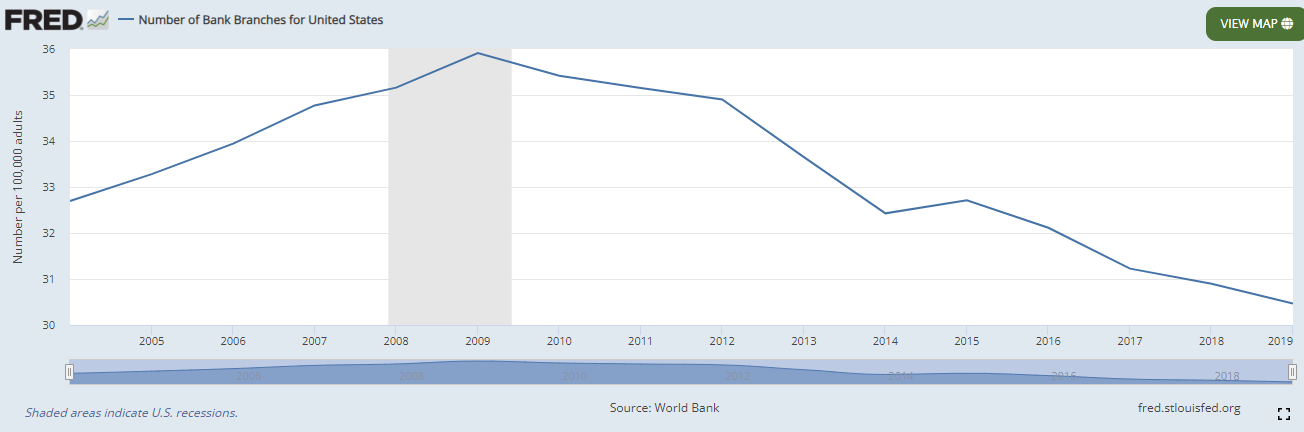
Multi-year shifts in consumer banking: Changes in technology enabled the shift to mobile & online banking, and the legacy banks continue to pivot to a hybrid model where you can bank in branch, on their website, or on mobile. Industry bank branches have declined from ~36,000 in 2009 to ~30,000 more recently.
Use of hard currency is declining, too, and more consumers have accepted direct banking and cashless transactions.
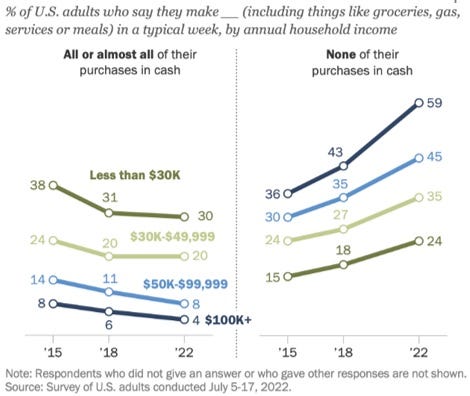
Those who use cash less often tend to be younger and/or wealthier than average, as you can see. That plays into Ally’s hand given its primary product today is large savings accounts paying high interest, and it’s online only. Given Ally’s customers have been growing 10% annually, it’s clearly taking market share partly as it benefits from this tailwind. It’s soaking up excess savings at high interest rates.
Direct banking:
Direct online banking can be a lower cost model. There are no branches, no tellers and their equipment, etc. Qualitatively, Citi has called out a lower cost to serve clients online/mobile vs. in-branch. Quantitatively, Ally spends ~0.4% of total assets directly on servicing deposits. Bank of America’s consumer deposit segment — a hybrid branch and online model — spends far more at 1.17%.
All-in, though, both Ally and Bank of America spend ~2% of their assets on noninterest expenses, which I believe is because the auto lending business is “high-touch” and has less inherent scale. To make auto loans in a big way, you’ve got to have relationships with >10,000 dealerships, you only sell a couple loans a month from each dealer, and the loan’s only for ~$35K. By contrast, a Bank of America has extreme scale when lending. One branch or lending team can be responsible for originating hundreds of millions in loans across many relationships. There’s also significant scale in commercial and corporate loans, where a large bank can originate ~$500 million loans on the same kind of back-end technology and risk infrastructure Ally’s originating $30K loans at. So the total cost structure on both the deposit-gathering side plus the lending side of the businesses adds up to something similar in both cases, while Ally’s paying more interest to hold onto deposits.
Another easy way to see this is to consider Ally’s replacement at GM. GM Financial spends nearly ~1.4% of assets on its noninterest expense, and is just doing the auto lending part of the business model without the running-a-consumer-bank part, so when management told us they’re spending ~0.4% on deposit-gathering, that seems in the ballpark to us: the two sides of the bank add up to ~2% in terms of overhead costs per dollar of assets.
Banking Overall
Lastly, for overall context, the industry’s very large and growing. The profit pool — not revenue — has grown ~4.5% annually from $123 billion in 2006 to $214 billion in 2019. Because the largest banks have been in the best position to navigate change and implement mobile banking and other payments technologies since then, they’ve taken market share as the industry slowly consolidated and many of America’s tiny banks fell behind.
This Industry section should have given you a sense of how the industry works, what’s causing it to grow, and how cyclical it is, and that Ally is soaking up deposit share (and is positioned to continue doing so). Ally’s also growing 3-5% annually on the lending just just by making car loans in its core business, excluding the new businesses it’s building, like credit card and commercial loans.
Competition & Ally’s position:
Lending market structure: auto lending is fragmented. Ally and Capital One are the largest lenders and have ~5-7% share among hundreds of lenders. Non-banks, like the captives and specialty consumer financing companies, also originate car loans.
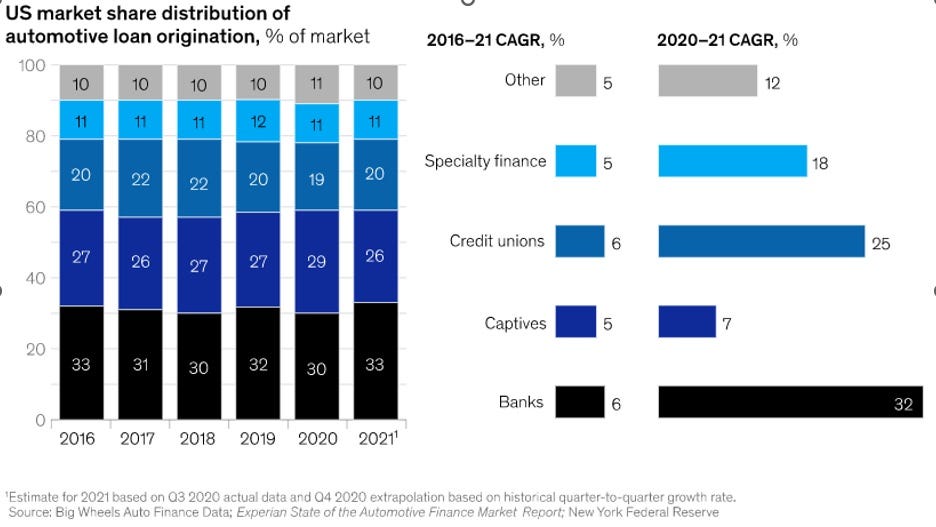
Banks and credit unions take lower cost retail deposits, while captive and specialty financiers use higher cost “wholesale” debt funding. Banks and credit unions are ~55% of the market and captives are ~25%, as shown below.
Where’s each player fit in the ecosystem?
Captives: as we said earlier, they focus on new car loans and help automakers drive sales while earning a decent return (~15% ROEs if good). The captives use wholesale funding, not deposits. They’ve a cost disadvantage: GM Financial’s current cost of debt funding is 4.2%, while Ally’s deposit base costs it 3.2%. When marketing, automakers offer below-market financing terms to incentivize sales, and then pay the captive to make it whole (called “subvention”). Subvention and sales promotions are easier to do when the two companies are combined. Because the interest rate is being subsidized, other lenders can’t compete unless the automaker subvents to them. The captives therefore live in this part of the ecosystem, financing ~50% of all new vehicles (according to Experian), and few used vehicles (<15% per GMF filings).
Banks: looking at several banks’ portfolios, they broadly tell the same story. They deploy low-cost deposit funds to lend to high quality super-prime borrowers for both new & used vehicles. They hardly lend to FICO scores below 660 (less than “prime”). Charge-offs are very low. We think what’s going on is this is a reasonably efficient business for traditional banks. Because these large banks have the lowest funding costs, they’re best suited to lend to the highest quality borrowers at the lowest interest rates (and where loss rates are very low). It’s also cost-efficient because the bank doesn’t need to invest heavily in activities like collections and debt restructuring because super-prime borrowers have such low default rates.
In all, we estimate auto lending earns a reasonably attractive 10-15% ROE from these banks’ perspective, and only they can compete for the highest quality loans. Others are often shut out.
Credit unions: have higher deposit costs because they attract them by offering higher interest rates, rather than by gathering deposits by being a one-stop-shop like a large bank (and where banks often have better mobile banking & payments technology). Consider that in 2016, Alliant, one of America’s largest credit unions was paying 1% for deposits even though the central bank rate was 0.5% and most large banks were paying almost 0%. As far as I can tell, the credit unions are the higher-cost operators in auto lending and have a harder time earning attractive returns: if everyone’s competing by charging similar interest rates for a loan, but you are renting deposits at 1% and the next guy is renting them for 0%, the other guy’s going to be more profitable.
Specialty lenders: based on articles, these businesses have low start-up costs, tend to enter during good times, and fold when things aren’t working (such as now when rising interest rates are pressuring their funding costs). Many of them tend to operate in the subprime lending space, where neither Ally, captives, other banks, or credit unions really play. That’s also often the case for independent dealers with “buy-here-pay-here” options where the dealer is basically using their own money to give you a reverse mortgage on the car.
Where’s Ally’s place in this ecosystem?
Ally’s between a credit union and a major bank.
Like a credit union, Ally’s funding costs aren’t the lowest: today, it focuses on pulling in consumers’ excess savings by offering attractive interest rates. Higher deposit costs then force Ally down into the prime and near-prime segments where higher interest rates more than compensate the lenders for the lower borrower quality and higher loss rates. Ally doesn’t really compete for the highest quality loans.
Here, though, Ally has the best capabilities, and is a specialist in the near-prime niche.
Consider the results first: Ally loses less than peers. Deep delinquency (90+ days past due) data9 show the industry averages >4%, and Ally averages <0.5%, a 3.5 percentage point outperformance despite the fact Ally’s portfolio skews near-prime (660 FICO scores).
Everyone has sales staff and overhead costs associated with going and making the same loans. But, if your borrowers default more often, it means you put in the effort to sell loans to them, and now you’re not getting paid any interest revenue (in addition to not getting more of your principal back). Hence, better loan performance means more than collecting more interest per dollar of principal loaned out. It also means more interest per dollar of sales effort and more per overhead dollar.
There’s also lower overhead cost overall if you’re smarter about lending: there are fewer delinquent borrowers to contact (email, text, call center telephone, etc.) and fewer “extensions” to work through by renegotiating loan terms with ailing borrowers to avoid having to repossess the car. It also means less spent on “recoveries”, the process of finding, repossessing, and auctioning vehicles. All of this adds overhead costs (call centers, etc.) for others lenders whose portfolios aren’t doing as well.
Why’s Ally’s portfolio outperforming despite the skew to lower quality borrowers?
First, distribution:
With 23,000 dealer relationships, Ally has twice as much reach as the next leading peers, Capital One and Wells Fargo.
Ally sees ~13 million loan applications annually, approves ~1/3rd on average, and ends up originating 1.3 million (~1/10th). The fact it sees so many deals means it can be choosy. Others face tougher profitability trade-offs when trying to grow their auto loan book because they have less reach. A lender’s commercial bankers grow dealer relationships one by one, so this distribution scale takes many, many years to build. Nobody’s going to match Ally any time soon, if ever. There are very few competitors of national scale.10
Ally also provides software, other products, and has a dealer loyalty program11, incentivizing dealers to give it more deal flow. Small lenders can’t replicate this, and large ones often choose not to because it isn’t their main business.
Second, skill:
Think of the lenders on a bell curve. Some are shrewd & price loans with nuance. Others don’t.
We don’t believe many of them use predictive analytics drawing on many inputs from credit applications and externally. Most use internal data, or this plus data from market data providers. Because most are small lenders, they don’t have internal data from a large cross section of the market, either.
My understanding is many still sometimes use “opinion-based” loan approval processes that aren’t evidence-based. Many competitors use also blunt tools to tune their origination volume up or down. If a bank like Wells Fargo wants to reduce its risk exposure, it will often just tighten up which credit scores its willing to lend to or not, without consideration to other nuance. This is what Wells did in 2022.
Ally, by contrast, makes very granular credit decisions. The company micro-segments the market into many classes of borrowers and vehicles. It knows the various depreciation rates of different brands and vehicle types, and thinks about which borrowers tend to default more than others based on a number of data points about the borrower.
This all feeds into its lending systems, and it makes approval decisions based on these proprietary insights. Others simply don’t have this, nor do many of them even care to figure it out
Third, focus:
Many banks and credit unions aren’t focused on autos. Their loan book is generally diversified across commercial loans, commercial and consumer real estate, credit card, etc. Auto is smaller by definition: commercial lending ($3 T) is 2x the size of the auto market. Consumer mortgage is ~10x. The average bank and credit union has less incentive to invest and win in auto because it’s easier to try and grow in other markets. Ally, on the other hand, goes so far as to ensure it has regional underwriters and other staff/services available for the dealerships to contact at any time. We have seen dealers complain that many of Ally’s competitors don’t.
Last, why aren’t big banks with lower cost deposits going after Ally’s attractive 15% returns on equity?
Naively speaking, if Wells Fargo, PNC, JPMorgan Chase, etc. can make ~10-15% returns on super-prime auto loans at lower interest rates because their deposits are so cheap, why aren’t they trying hard to move into the near-prime market where interest rates are higher and Ally’s making 15-20% returns on equity? They’re even pulling back overall!12 Analysts often ask Ally on conference calls and they’re concerned about the sustainability of these profits.
We don’t think these analysts understand what’s in the secret sauce here.
What matters is this: just like looking at someone else’s success won’t tell if if you’ll be a success, looking only at Ally’s profitability won’t tell you how profitable or easy it would be for other banks, either.
Several things discourage money-center banks even though they’ve got a deposit cost advantage over Ally:
They lack the skill to achieve best-in-class loss rates. They don’t have the massive distribution and proprietary data Ally does, and so they can’t cherry-pick the best loans, like we said above. Competitors would end up with higher delinquencies and charge-offs if they tried what Ally does.
Higher overhead cost: this is the biggest issue. A bank would need to invest significantly into overhead costs if it moved down from super-prime loans into near-prime lending. Super-prime delinquency rates are close to zero, while they’re several percentage points higher on near prime loans. Because the borrowers fail to pay more often, it means the bank would have to invest heavily in loan restructuring, collections, and other capabilities. I estimate it’d have to increase the size of its operation by 2-10 times. It’s just incredibly unlikely any executive team is going to want to make that investment. It won’t happen, they won’t do it, and they haven’t done it in the last 3 decades, either. We confirmed this cost difference with Ally and with experienced back-office banking consultants.
It’s a smaller business: we showed you that at most banks, auto is a smaller business vs. commercial lending, consumer mortgage, credit card, etc. Auto lending’s smaller size, combined with the large cost investment needed and the fact it takes years to build dealer relationships one-by one all mean that this is not low-hanging fruit for anyone to go after. Why bother when you can just make more $100 million loans to large commercial borrowers like private equity funds etc. with the lending teams and infrastructure you already have?
Others are strongly disincentivized from entering Ally’s niche to compete with it. At the same time, Ally’s scale and skill in this niche let it clobber small and big banks alike, credit unions, and others.
Hence, even though Ally has higher cost deposits, there’s still this subtle moat around its castle. It can still make the business model worth and earn attractive 12-15%+ ROEs because, in this protected niche, the risk-adjusted interest rates on its auto loans are much better than what other banks see, and are better than products like low-rate mortgages where the money-center banks invest their low-cost deposits. A high-deposit-cost bank can do just find if it finds attractive market niches to play in.
You should also note: this shows Ally’s management is skilled. They built all this capability. None of it magically fell into shareholders’ laps. The company’s highly strategic and forward-thinking.
Ally is building several other businesses that are a little different competitively, but they’re small today and what I’ve learned so far is in Appendix B of the attached report.
Ally’s also trying to lower its deposit costs and it’s cost disadvantage is going to shrink. We talk about this below as we go over the business model next. That’s it for the industry and the competitive landscape.
Ally’s Businesses & Key Economic Levers
Banks begin with the balance sheet. The 2022 balance sheet and 1Q23 loan book are:
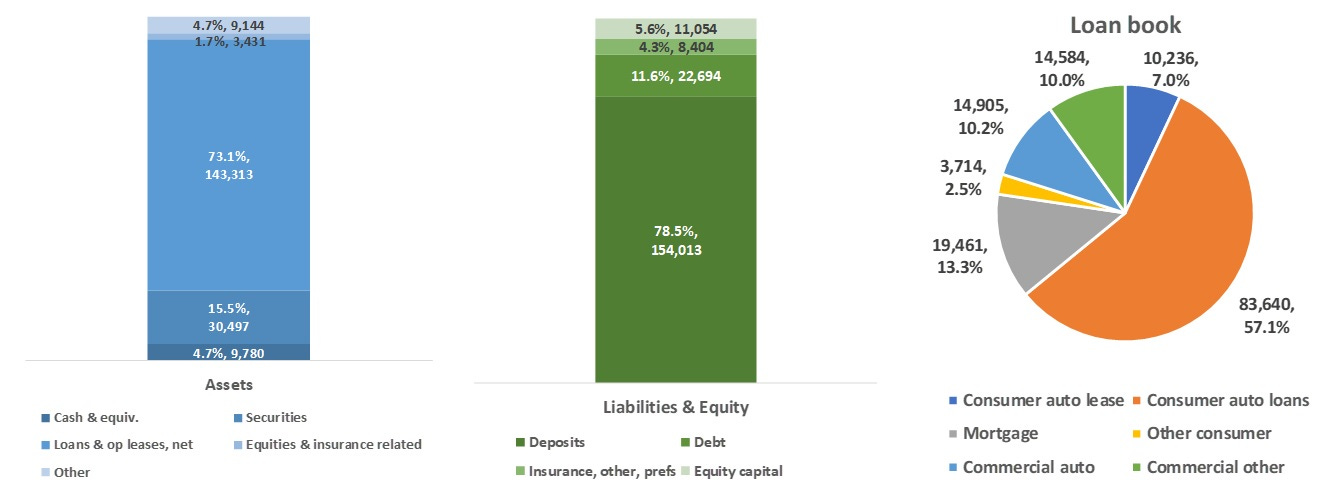
Each piece of the balance sheet is as follows.
Securities: primarily long-term US Treasurys (government bonds) and aMBS (agency mortgage-backed securities, which are insured mortgages and so are like government bonds given very low credit risk).
Not counted above is $4.8 billion ($16/share) in gross unrealized losses in the securities book. The bonds and aMBS are long-duration and have fixed interest rates, so they’ve lost value as interest rates rose. In plain English, Ally bought some bonds when interest rates were lower. Those bonds are now worth ~15% less than par value because nobody would buy a 2% bond at par if a similar 4.5% bond can be bought today instead. The bond portfolio turns over as the securities mature, which causes these losses to unwind naturally. As you’ll see, we’re not paying for any of this unwind at the current stock price, and ~$2 billion of this capital loss will accrete back to us over the next 5 years.
Loans: the $143 billion (net of credit loss provisions) loan book is as shown above. Key features and components of the book are discussed below.
Insurance: attached to the bank is an insurer providing floorplan insurance to dealerships and vehicle maintenance contracts to consumers. The insurer’s profits aren’t correlated to the economy, helping Ally offset credit losses during tough times. The insurance business isn’t key to our thesis, though, and we’re not going to go into detail on it.
On the liability side of the balance sheet, we have deposits and debt: as we mentioned, Ally historically reduced its funding costs by replacing wholesale debt with retail deposits the bank has been gathering as it grew. Ally’s done with this first phase of becoming a bank.
We go over key profit drivers next. The key will be understanding balance sheet behavior: how changes in the loan rates and deposit costs are drive the net interest income — the bank’s revenue — and its net interest margins. Our thesis has everything to do with this net revenue, and nothing to do with costs.
Deposit history and future:
Ally has 2.7 million depositors as shown, who have 5.0 million accounts. This has grown 14% annually since 1Q 2016. Deposit dollars have grown 12.6% annually, from $66.2 billion in 2015, to $152.3 billion in 2022.

As we mentioned, Ally’s mainly gathering savings deposits by offering high interest rates.
Going forward, though, there are now two reasons Ally’s deposit costs should fall vs. prevailing industry rates and vs. Ally’s history:
Incentives have changed. Ally doesn’t have urgency to price deposits aggressively anymore.
The auto loan book dominates Ally’s asset base (73% of assets), and assets are growing slowly at ~2.8% annually since 2015. This isn’t as fast as the 13% deposit growth Ally had while it was trying to replace its high cost debt funding. Since deposits are now ~90% of the bank’s funding, it’s done racing to get deposits.
Slow growth in assets and no need to fix the funding profile mean that Ally doesn’t have any impetus to rapidly grow deposits anymore.
Management’s smart, so this means one of two things will now happen: either Ally continues growing its lending businesses at a fast clip, or it doesn’t and it prices deposits less aggressively instead because it just doesn’t need the money. Its profitability would grow either way.
Ally already knows this and is executing on it:
“We continue to focus on efficient deposit growth by continuing to expand the deposit value proposition beyond competitive deposit rates” – 2022 Annual Report
Customer stickiness:
Major banks like Bank of America have low cost deposits because they have a deep relationship with the customer. The average money-center depositor has 5-7 products with their bank. That makes it hard to switch. So customers keep their primary bank for a very long time, and churn is ~4%. Bank executives have repeatedly told us clients with more products leave less often.
Banks extracts value from this entrenched relationship by paying below-market rates on products like checking accounts.
Ally’s getting there. It’s expanding its product suite, such as into credit cards, other personal loans, mortgages, and investment brokerage. This is successfully deepening the average relationship:
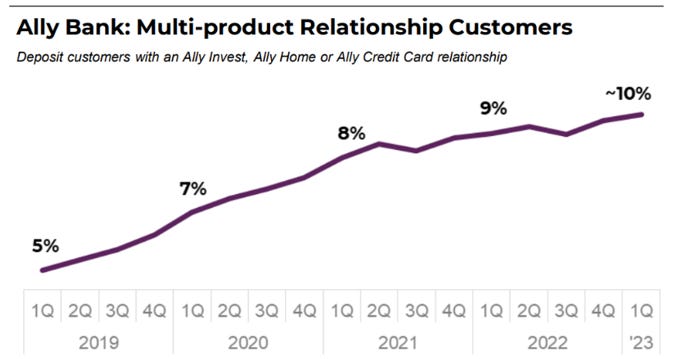
Already, Ally used to be ~#8 in the US in terms of highest rates offered. Today, it’s often ~#25. This is “easy” to do as well, because Ally doesn’t have to do anything unique. It’s just copying how the most entrenched large banks already make their money.
“Our deposits franchise is key to growing and building momentum across […] Ally Home, Ally Invest, Ally Lending, and Ally Credit Card, consistent with our strategic objective to grow multi-product customers.” – 2022 Annual Report
“And as we grow both balances as well as digital capabilities, the beta [price sensitivity] on that business is going to continue to decline.” – 1Q21 Earnings Call
“We are continuing to invest in differentiated capabilities, and that’s across auto, it’s across our deposit franchise. Those capabilities reduce price elasticity across the board and allow us to continue due to our strong pricing position to deliver that NIM expansion.” – 1Q21 Earnings Call
Ally has every reason to show more price discipline in the future. The stock market doesn’t care because this isn’t yet apparent in its NIMs.
This’ll also be easier when industry deposits start growing again. Ally can’t just drop its rates. It needs to massage it in as rates change, product penetration grows, and it acquires customers. It’ll be balancing this with product growth, etc.
Capital One’s online bank is a useful precedent here, too, because it’s much older and farther along this journey. ~10% of its deposits are “non-interest bearing”, which mostly means core customer checking accounts. This demonstrates to us it’s possible to gather zero-cost, operational deposits online, and that Ally has the capacity to do so as it executes on plan and its customers get stickier.
What’s this worth? If Ally dropped deposit rates 0.35%, or <10% of current rates, it could grow NII by $500 million, or ~$300 million pre-tax. That’s ~$0.80/share, or ~$10 in value/share, +35% on the current price. That 0.35% is only ~20% of the 1.5% typical difference between Ally’s rates and big banks. We can’t know precisely how much we’ll get, but none is priced into the stock (see Valuation). This is low-hanging fruit. The market’s sleeping on it because it hasn’t happened yet and there’s no obvious evidence anyone can just point to. You need contextual knowledge and an understanding of Ally’s economic incentives to call the odds on this.
Net Interest Margin Behavior
We’ll go over Ally’s NIM behavior now, then we’ll get into the issue of falling car prices and loans once we know how Ally’s revenue margins work.
Deposit behavior: deposits (gray line below) repriced within ~6 quarters during prior Fed rate cuts (blue line below). Ally’s deposits are price-sensitive because savings accounts compete closely with alternatives like money market funds, compared to a bank with a checking-account-focused deposit base.
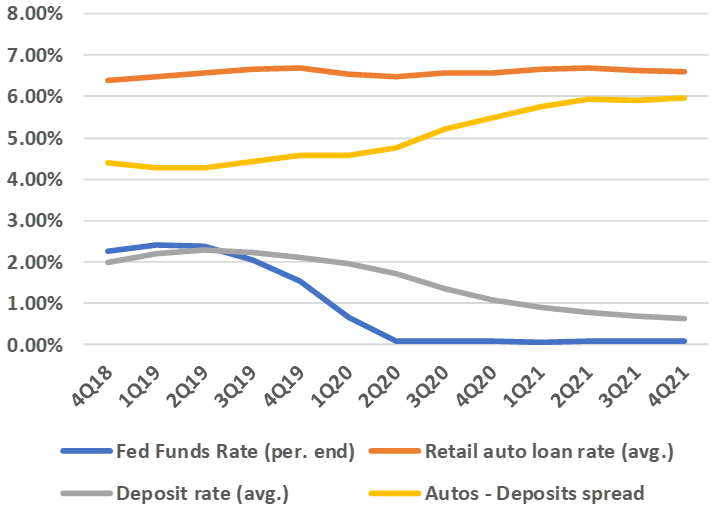
Loan behavior: most of Ally’s loans are auto loans. These have fixed interest rates. Thus, they only “reprice” as the loan book turns over: one borrower finishes paying their car loan, then another buys a car and gets a loan). It takes ~3 yrs for the book to turn over, so it’s slower than the ~1.5 year deposit repricing you see above. This means Ally’s margins (NIM) expand when interest rates fall, and contract when interest rates rise13. You can see that in the yellow line above which shows the difference (“spread”) between Ally’s deposit costs and the yield on its auto loan book, which rose as the central bank cut interest rates. For most other banks, more of their loans are floating rate, and so their balance sheet behaves the opposite of Ally.
The the reverse is now happening: Ally’s NIMs are contracting as the Fed hikes short-term rates. The charts below split this out in terms of auto loan pricing on the left and deposit pricing on the right:

The green originated yield on the left chart is the rate Ally gets when it makes a brand new auto loan. This is moving almost in lock-step with deposits and is more closely tracking the Fed’s interest rate hikes.
However, the purple portfolio yield is the actual interest rate the loan book is earning for us. It isn’t tracking along with the originated yield. This is because, again, the originated yield is today’s rate, but the total rate on the loan book is the average of all the interest rates of the loans Ally to borrowers over the last several years.
There’s now a growing gap: Ally’s originating new auto loans at the 10.9% but the existing book is earning 8.5%.
If you hold rates constant as the book turns over:
The loan book yield will migrate upward 2.4% from the 8.5% average to today’s 10.9% rates you can see above. An incremental 2.4% on the $80 billion loan book14 implies +$1.9 billion interest income.
At the same time, Ally’s deposit costs will rise less: prevailing savings accounts rates are ~4% vs. the 3.2% average across all Ally’s deposits, so the rate would migrate up 0.8% (from 3.2% to 4%). Assuming +1.0%, this is $1.4 billion in interest costs. But remember: Ally can be price-disciplined on deposits going forward because it doesn’t want your money as badly as it did in the past.
This implies $1.9 incremental interest income, minus $1.4 billion incremental interest cost. $1.9 - $1.4 = $500 million incremental NII. Take that with a grain of salt, but we’re directionally right, and this is what we model in. There isn’t room for deposit prices to close the whole gap, since it would imply Ally pays more than money market rates. That wouldn’t happen.
Loan growth drivers near- & longer-term, and impacts to NII:
(If you’re not asleep yet, awesome! Have a stretch and finish your coffee. We’re nearly there.)
For consumer vehicle loans & leases (~$94 billion net, ~64% of total loans & leases), we’ll cover 3 things: (1) long-term growth and the impact of falling vehicle prices on Ally’s NII (one of the market’s concerns over the stock), (2) distribution growth with the dealers, and (3) one last headwind from Ally’s GMAC days.
Falling vehicle prices: Ally’s loan book is the volume of vehicles it originates loans against, at the prices each vehicle was sold at.
Price: a correction in used car prices is underway and a further ~25% decline seems reasonable15 over the next ~2 yrs. There’s been no correction in new vehicle prices yet, which are up +20% since COVID according to US CPI data; I still punitively apply -25% to the entire auto loan book, for example because the new vehicle parts shortage is unwinding.
Volume: falling prices should be partly offset by ~10% volume growth as the vehicle shortage continues to unwind. Used vehicle sales volumes should normalize from 35 million toward 40 million annually, and new vehicles from 15.5 million to 17.5 million. Note that in a shallow recession like 2001, there was little impact to car sales. The shortage is also what’s pushing up prices, so there can’t be downward pressure on prices without volumes rising, given the currently-high underlying consumer demand. We don’t think the market cares volume is an offsetting factor because of significant recession concerns, but this only delays the volume recovery.
This gets us the ~15% origination decline we model near-term. We assume a delayed ~3 year volume recovery, though, baking in a potentially-impending recession. Note that it’s very plausible that new vehicle prices fall far less than what we’ve modeled, maybe only 10% given underlying cost inflation in materials, energy, workers’ wages, etc.
By assuming the whole loan book declines 15% instantly (rather than declining slowly as lower originations work their way in), the pen-and-paper way to think about it is this:
$94 billion consumer vehicle loans and leases * 15% decline = $14 b in lost loans, which are earning ~8%.
These funds would most likely be allocated to cash & securities at >4.5% interest, as long-term bonds are >4.5% and insured & secured mortgages are >5.5%.
The deposit cost for the loans and securities are the same, since it’s all funded from the same depositor base.
This is: $14 billion * ~(8% portfolio yield – 4% yield on securities + 0% change in funding costs) = ~$550 million lost NII.
Because risk-free bonds don’t default and auto buyers do, expected credit costs will also decline by ~1.2% of the $14 billion that the bank will get from its loan book and put into the securities book. That’s ~$170 million.
This gets you -$550 million + $170 million = -$390 million lost NII plus improved credit costs.
Assume this flows through operating expense at 90% fixed, for a $350 million decline in pre-tax profit, or $270 million after tax, or $0.90/share, or ~15% of normalized earnings.
This is clearly a headwind and it’s impossible to know the exact trajectory and size of the impact, but it’s clearly not huge.
The cool part is that there are at least 5 offsetting factors to this lost profit:
First, we discussed the locked-up value of Ally’s deposit base, worth $100s millions NII since Ally’s deposit pricing incentives have changed. We did the math on a potential $500 million NII above. This will help Ally long-term but will also be a tailwind in a recession, since Ally’s NIMs would rise sharply, as we talked about.
Second, we discussed incremental NII of up to $500 million if you hold rates constant and let the loan book turn over into higher market rates. This alone could offset the $350 million issue you see above. We think the market doesn’t care since it’s not yet showing in the financials. We’ve talked to investors who are uncertain about how this works and thus have adopted a “wait and see” attitude despite the facts. Ally’s originating some of the highest ROE loans it ever has.
Third, there’s a “yield pick-up” on Ally’s securities book as it “rolls” low-yielding maturing bonds into higher rate bonds. This is the same effect as how the auto loan book’s yield rises as it turns over into higher prevailing interest rates, except that it’s also happening in the securities book as older bonds with lower rates mature and the cash is reinvested (or “rolled”) into new bonds at today’s interest rates. Ally is rolling >$4 billion per year and should pick up up to ~3 percentage points16 on that, or >$120 million in NII at current rates.
Fourth, Ally’s credit card business will likely have a +~$100 million effect on NII as well, discussed later.
Fifth, long-term used vehicle market growth will offset lower prices, as underlying industry growth is driven by ~3-5%/yr tailwinds we discussed in the Industry section. We model this and it partly offsets falling prices.
Obviously, there’s no certainty around how much one gets from which, but it’s incredibly clear that if we see even a whiff of benefit from any combination of the above, falling vehicle prices is a non-issue.
Distribution growth with the dealers:
Our working assumption is there’s no room for growth in Ally’s 23,000 dealer relationships. There are ~18,000 franchised dealers in the US and ~60,000 independents. Ally disclosed the following about dealer originations in 2022:
It’s primarily focused on franchised dealers and auto retailers (e.g., CarMax).
66% of “growth channel” relationships were with the franchised dealers (Jane Doe Ford, John Hancock Honda, etc.)
56% of originations are in the “growth channel”.
The remaining originations are 22% with Chrysler and 22% with GM dealers (i.e., also franchised).
This gets us 66% * 56% + 22% + 22% = ~81% of originations are with franchised dealers,
81% * 23,000 = ~18,500 dealers, which is about equal to how many franchised dealers there are in America
Unless we find new information, there’s likely no real franchised dealer growth left, although there’s plenty of potential growth with the used vehicle dealers.
Though Ally is not focused on growing with the independent dealers, it has 23,000 - 18,000 = 5,000 relationships already, which is <10% of the market. The primary issue is that Ally can only focus on dealers with financial strength (such as those with more than one location, etc.) so that it avoids large credit losses.
Ally told us, however, that the company has opportunities to increase dealer loan flow. Many dealers give it only 1 application a month, whereas the average dealer is selling ~70 units/month in new vehicles alone17. The business could grow share this way, and I’ve found no structural reason why it can’t gain share per dealer, particularly since it has the best product offering. Capital One for example originate a similar volume as Ally yet distributes through only half as many dealers (12,000 vs. 23,000). Capital One’s delinquencies are much higher, though, which jives with management commentary that Ally’s simply turned down the origination spigot and adopted a more defensive posture to increase returns on capital. Consider Ally’s market share has been constant for years despite growing the number of dealers it does business with. It’s just originating fewer loans at higher expected profitability (referred to as “high-grading” a portfolio). If deposit costs fell, Ally could turn the spigot back up and earn the same ROEs despite lending to lower quality borrowers.
The table below shows the historical effect of Ally’s distribution growth and pivot into the used vehicle market and away from GM.

Historical and future headwinds from the pivot away from new vehicle lending:
[I removed this from the online post, but it’s still in the attached report in the same section. It’s not key to our thesis. There’s Also additional info in Appendix D in the attached report.]
Other banking & loan product growth drivers
This is less important today. It’s in Appendix E of the attached report for anyone to read.
Loan loss performance: Net charge-offs (NCOs) and our future expectations
GMAC’s through-cycle auto NCOs are muddy due to 2009 changes to accounting rules, but we’ve reconstructed the charge-off performance below. Ally’s been a disciplined auto lender, even since GMAC.
In 2008 auto loan NCOs were 2%. I estimate they peaked in 2009 at ~$800 million on a >~$30 billion book (2.67% NCO rate). In 2010, NCOs fell to ~2%. Beyond 2010, the data is clean under Ally’s annual reports. The chart shows our reconstruction18:
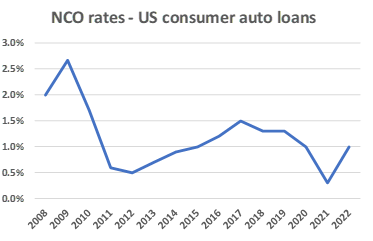
Performance is strong given the circumstances (~10% peak unemployment). This portfolio outperformed many well-managed US banks’ consumer mortgage books at the time despite mortgage being widely accepted as one of the lowest risk asset classes. For context, WFC’s consumer auto NCOs peaked at 4.5% in 2009, and JPM’s peaked at 1.5%19. Others we looked at such as COF peaked in the 4% range. Ally looks above average, though we have no industry-wide dataset.
“Auto consistently ranks near the top of the consumer payment waterfall, a trend that has persisted across several cycles reflecting the strong value of the secured asset class” – Jenn LaClair, CFO, Ally Financial 1Q21
We also discussed delinquencies in the section on competition, where Ally has tended to have far fewer delinquent borrowers. It’s clearly outperforming the industry.
The only thing to think about going forward vs. history is that the mix of loans is different today. The portfolio’s credit scores are similar then and now, as >90% of loans were and are to near-prime consumers or above (FICO scores >620). However, ~67% of Ally’s auto loans today are against used vehicles while GMAC was ~90% new vehicles. Used buyers tend to default more, and that’s why Ally now expects losses to be ~0.3 percentage points higher: it used to say NCOs would be high 1%’s and now says it’s underwriting low 2%’s in a garden variety recession. It’s being more than compensated for this with significantly higher interest rates. In our judgment, we expect ~3% peak NCOs in a very severe recession like the GFC, and are modeling 4% in our downside case. We think this is very punitive, particularly in light of consumers’ very strong financial positions today, which don’t resemble anything close to the financial crisis.
Putting this together, we think assuming next 2-year NCOs of ~2.5% is reasonable-to-punitive given Ally’s book quality today, its outperformance, and the economic backdrop. This is how we model the base case, assuming 1.6% thereafter based on what management’s underwriting to20. We assume the same in auto leases and across other loans for simplicity21.
For commercial loans to dealers, peak NCOs were 0.4% in 2009. Loan terms are similar today. Ally lends 100% of the wholesale price of vehicle inventory and obtains additional security like personal guarantees from dealership owners. The commercial book is small and NCO rates are small, so this doesn’t drive potential losses or the bank’s value.
Securities book:
The bonds mature and the mortgage-backed securities mature and “pre-pay” as homeowners pay off their mortgages. As a result, I estimate that $16 per share unrealized loss we mentioned will slowly “accrete” back to Ally, at over $1 per share per year, and we model this in.
Noninterest costs:
Consolidated expenses are as shown. Noninterest expenses are typically mid 50’s as a % of revenue (which banks call the efficiency ratio). We model this expense intensity going forward. I’ll also point out we’re modeling rising expenses through our recessionary scenarios. This is pessimistic because 2022 expenses were elevated as Ally invested in costs to scale its card, personal lending, and commercial lending businesses. It likely has a room to pull back as needed. Changing expenses by ~1 percentage point changes our valuation 1% and doesn’t drive the thesis.

Capital & Liquidity:
This is a little complicated and I’ve left it out of our simplified write-up, but you can find it in the report in the subsection with the same title. Suffice it to say that because of securities losses, Ally needs to rebuild capital from 7% of “risk-weighted assets” (a regulatory term) to its 9% internal target, which will take ~3 years (even through a recession).
Liquidity: Ally’s balance sheet is highly liquid. It can sell any of its $29 billion securities book (currently at a ~15% loss) to fund cash needs if deposits decline. It also receives ~$35 billion annually in auto loan/lease principal maturities and prepayments. Combined, this is ~$64 billion against on $152 billion of deposits, or 42% of deposits in annual liquidity. Nearly all of Ally’s deposits are insured, and there’s no customer concentration with a limited group of depositors. A run on that type of deposit base is what caused the collapse of Silicon Valley Bank. Ally’s nothing like that.
Ally can also borrow from the Federal Home Loan Banks system and from the Federal Reserve via the “discount window” and “bank term funding program”.
Finally, Ally is highly unlikely to experience liquidity issues despite falling deposits industry-wide because of the rates it offers — Ally is part of the reason that other banks’ deposits are falling.
Insurance:
See Appendix F in the attached report for information if you like. Insurance doesn’t matter to the thesis other than the fact its cash flows are not correlated to the consumer auto lending business or to the economy, so these profits are going to buoy Ally in bad times. It’s also only important in the sense that it’s another set of products Ally can cross-sell to dealerships, leverage the cost of the relationship, and make its value proposition to the dealer stronger than any other lender. Insurance is currently facing headwinds as the vehicle supply shortage means there’s less dealer inventory on the lot, so less needs to be insured.
Management
We evaluate management on: (1) operations & strategy, (2) capital allocation (how they spend shareholders’ profits), and (3) candor/integrity/incentives.
In banking, management is especially important. Banks make a little bit of money most of the time, then lose a lot some of the time. At a good bank, this averages out fine for the owners. However, if banks screw up badly, they die and are seized by the FDIC to protect the depositors. The game’s over and you lose your investment.
Operations:
Auto lending: Ally’s record has been excellent despite its skew to near-prime loans, as we showed above. Losses are below comparable peers. Management also put the lending business into a competitive spot that’s hard to invade.
Deposits & customers: Ally’s been growing customers and deposits at a strong clip for years, replacing high-cost debt. It paid up for deposits but still improved profitability. Management’s now positioning Ally to reduce its overall deposit costs and customer price sensitivity. They’re making structural improvements to the economics of this business.
New initiatives: Ally’s been growing credit card, point-of-sale, and commercial loans. These are all reasonable-to-very-attractive lending markets, particularly card. These diversify Ally’s loan loss profile, let it put deposit growth to work, and give it opportunities to cross-sell and deepen the customer relationship, reducing customer price sensitivity. We don’t know exactly what Ally will look like as management executes, but we like what they’re doing.
Capital allocation:
Organic reinvestment has been smart. Ally pivoted to better risk-adjusted margin loans (near-prime borrowers; used vehicles) while maintaining low losses and outperformance vs. the industry. As we mentioned, public disclosures and our conversations indicate Ally has capacity to increase loan volumes but is instead focusing on even more profitable loans in the current environment, meaning it’s getting more disciplined.
Despite near-term macroeconomic concerns, Ally’s still leaning into the market and feels current loan rates more than compensate us for the risk of loss, even if deposit costs rose. Ally’s currently originating at >20% ROEs according to its own data and scenario testing. This makes a lot of sense to a long-term owner of the business.
Bought & built businesses: Excluding partly-owned BMC (a mortgage originator), Ally’s acquisitions and internal growth projects are going well as the company stitches together a diversified consumer bank.
Ally Invest is gaining brokerage customers and assets under management as the company markets to its depositors and borrowers.
The card business it acquired is rapidly growing customers (for the same reasons as Ally Invest), fees, and card balances, and is outperforming management’s original assumptions; and
The commercial loan (loans to businesses) business is growing relationships and balances.
BMC is doing poorly as the rapid rise in interest rates effectively shut down the mortgage market. Every bank’s having this issue, so it’s hardly a bad call ex-ante. Ally’s made back the original investment. BMC lets Ally selectively grow mortgages without spending on costs. This is why Ally’s mortgage business isn’t burning cash while others such as Wells Fargo are downsizing to stop the bleeding.
Candor, motives, and integrity: we believe Ally is candid with us.
When NIMs deteriorated and securities losses mounted as rates rose, Ally disclosed more rather than hide. Ally’s new CFO walked investors through loan book and deposit repricing mechanics to detail how NIMs will move under various scenarios. By contrast, Silicon Valley Bank removed certain disclosures because they looked bad, and the bank went to zero earlier this year.
Management points out the ROE is lower when correctly adding back prior losses in the securities book, rather than claiming profitability is artificially high (and being paid bonuses on such).
Compensation: management is measured on rolling 3 year:
“Core ROTCE excl. OCI” which measures profitability on our capital after adding back prior losses in the securities book. Whether the portfolio’s in a gain or loss position, it doesn’t reflect original cost basis of the capital invested, so this more accurately reflects Ally’s true ROE. Targets are set annually.
“Total shareholder value growth”: tangible book value per share growth plus dividends, which for a bank is a good yardstick for intrinsic value growth.
Total returns (in market value) vs. a bank peer group.
Management’s compensation is also voided or “clawed back” in the event of excessive losses.
Shorter term bonuses are based on a scorecard that includes the metrics above plus loan and deposit growth, customer growth, customer satisfaction, employee engagement/retention, and risk management. All employees are also granted 100 shares annually to encourage an ownership mentality and align their interests with ours. In my experience, this is rare. We like it so much we’re probably going to write a short post about it.
Risks & Short Thesis
Regulatory change: after the collapse of SVB and others, change is afoot. Regulators are hinting at punishments like asset limits for those with weak risk management (incl. asset-liability matching & duration risk). Banks think the available-for-sale securities opt-out in their capital base is also going away. This is where bonds held in the AFS book are marked to market on the financials but are held at cost when calculating the bank’s regulatory capital. Banks in a loss position look better when using the opt-out. Ally’s already filling the hole in anticipation of it being phased out. In general, regulatory change like the 2010 Dodd-Frank Act hasn’t much changed banks’ competitive positions or the fundamentals of the business model, although it has caused market share losses to the alternative asset management industry.
Impact of lower car prices on charge-offs: Ally said a 5% change in prices is an incremental 0.02% on NCOs, which doesn’t matter.
OEMs/Captive incentives change: auto OEMs are looking to capture revenue over the vehicle life cycle rather than nearly just from a new car sale. They’re selling software e.g., Ford Blue Cruise, Tesla Autopilot, etc. This may change OEMs’ incentives: maybe they’ll care about financing used vehicles because it drives ongoing software subscriptions (e.g., they could bundle the two products). In this world, Ally still has a funding cost advantage and underwriting advantage. Ally will also be more diversified by the time this happens.
Private credit: higher capital requirements at banks have made certain loans uneconomic for banks to make. But regulatory requirements don’t change the demand for credit to finance businesses.
The alternative asset management industry exploited this regulatory arbitrage and grew into commercial lending with private credit funds which often lend to mid-sized businesses. Given there’s no regulation, the loans are made on bespoke negotiated terms. Bank loans must meet regulatory requirements and aren’t bespoke. We don’t think the alt. managers can come after auto lending because it’s onerous to build the needed distribution (dealer relationships one by one) and infrastructure (e.g., auctioning repossessed vehicles). They also lack Ally’s sophistication and data when it comes to pricing loans, evaluating borrowers, and valuing the collateral.
Contracting credit spreads: when the economy expands, it’s auto lending will likely get a little more competitive. We already model normalized ROEs well below the returns Ally’s currently originating at and its own internal targets, though, and there’s still significant upside.
Qualitative risk assessment: Moderate. Our rationale: (1) management quality: good, (2) probability of obsolescence: very low, (3) industry rate of change: very slow, (4) debt: appropriate, (5) cyclicality: moderate, (6) industry competitiveness & difficulty: moderate, (7) competitive position & durability: narrow moat, (8) long-term profit predictability: high (but variable).
Short thesis: why avoid Ally or short the stock? How would it all go wrong?
Severe recession: charge-offs will increase significantly, and originations will fall with lower vehicle sales. For investors looking at short-term fundamental momentum (most investors), all the key drivers will be pointing the wrong way, and the stock almost certainly won’t do well. This is an obvious reason to want to short the stock near-term. The evidence is that Ally has the staying power to weather a severe storm, however.
New competition drives down loan returns: we’ve seen no evidence of this so far, and the difficulty of playing in Ally’s market niche means there won’t be a wave of competition. It’s periodically a concern about the company.
Large defaults in the commercial book: this book’s growing rapidly and will be a meaningful contributor to NCOs going forward, as will the credit card book. Poor underwriting would lead to large losses. The company is new to commercial lending and to credit card (although the credit team that came with the acquired business is seasoned).
Extreme pressure and competition for deposits: industry deposits are falling today (mostly due to unwinding excess liquidity, as we discussed). There’s fear this will spark banks competing to hold onto them. We’ve seen that banks in dire need of deposits haven’t been able to gather them even if they wanted (see Silicon Valley Bank and Signature Bank), and those with excess deposits like BAC, JPM, etc. are letting them run off because there’s a lack of loan growth, so they don’t care. Obviously, because rates are higher, there is still going to be rotation into CDs and higher interest savings accounts, but that plays into Ally’s offerings. Behaviorally, hyper-competition to keep deposits just isn’t happening despite this being only the 4th time since 1934 that industry deposits declined.
Valuation
Our model’s a little complicated so I’ve laid out a simplified overview of our assumptions and the outputs. See the table.
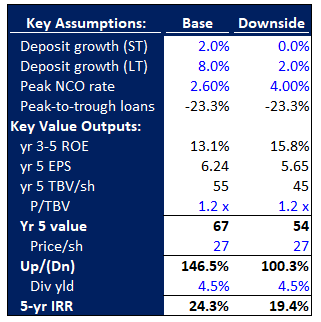
Our Base case (+145% in 5 yrs, ~24% rate of return) assumes an immediate garden-variety recession, plus the normalization of vehicle prices that we discussed. These imply the loan book shrinks up to ~23% because of lower originations from both lower vehicle unit sales and prices. This is followed by a recovery and credit/deposit growth in year ~3.
Loan volumes: I assume vehicle prices decline 25% over 2 years, followed by new (15.5 mm —> 17.5mm) and used (19.1 mm —> 22.5mm) vehicle volumes returning to peak. For simplicity, I assume lower prices immediately impact the size of the book, rather than slowly as it turns over. We assume some management success growing the credit card, commercial lending, and other nascent businesses given low penetration and millions of untapped customers Ally already has relationships with. As the loan book shrinks, we assume excess deposits are held as cash & securities.
Rates: we assume short-term rates fall and NIMs expand as deposits reprice faster than loans, then rates subsequently normalize upward.
NCOs: we assume NCOs rise to 2.6% and level off at 1.6%. We assume this NCO rate on the entire book, for simplicity, which is slightly punitive as this is high for commercial loans and mortgages that make up most of the rest (but low for card).
Deposits: we assume pressure continues with deposits growing 2% near term, reverting to 8% as Ally continues taking share. We don’t assume deposits shrink like competitors because Ally’s higher rates are partly the reason competitors’ deposits are shrinking.
Securities: we assume the securities book matures/prepays, and so slowly accretes to par. Our own back-of-envelope math is in line with what management said, and we assume ~$400 million tangible book value accretion annually, which adds over $5 per share over 5 years and isn’t subject to credit losses.
In this scenario, Ally will have grown its tangible book value to $55 per share in 5 years. Given it’s earning more than the opportunity cost of equity (“COE”, ~10%), it’d be worth a premium to TBV, and we assume 1.2x (using a simplified 12% ROE / 10% COE). If the company hits its own targets, it’d be worth over 1.5x TBV.
Downside case (+100% 5 yrs, 19% rate of return): immediate severe recession & vehicle price normalization, followed by a recovery like the above.
Loan volumes & rates: I assume the same trajectory as the base case.
NCOs: we assume peak NCOs of 4%, which we think is extremely punitive and worse than the Great Recession. Near term, Ally loses ~$2.1 billion on $10 billion in equity capital (21%), which takes ~2 years to rebuild. Note at the current stock price we’re already only paying $8-8.5 billion for that $10 billion in equity capital.
Deposits: we assume a similar but worse trajectory to the base case given ongoing contraction of the money supply and spend-down of excess consumer savings.
Back of envelope math on Ally’s current earning power:
Pre-provision net revenue: 3.7b PPNR @ ~3.9% NIM = 8.4 b net revenue – 1.9 b compensation expense – 2.5 b other expense – 0.3 b insurance costs (net).
You can then consider whatever loss rate (on $140 billion in gross loans, of which 94 is consumer auto loan + lease) you like to get from PPNR to pre-tax income. E.g., assuming 2.6% NCOs on the entire book as shown = $3.64 b in credit losses, implying ~break-even next year, almost identical to our year 1 model output.
Other edge cases:
Very high inflation & interest rates: we’ve found little evidence inflation would move to 7-12%. If it happened, Ally’s NIMs would continue falling until interest rates stopped rising. We’d have to re-evaluate the idea. This said, in the recent and rapid rate hikes, auto loan rates repriced quickly and Ally didn’t lose much NIM. The company now also has additional pay-fixed interest rate swap derivatives which reduce its exposure if rates continued to climb.
Multiple entrants into near-prime auto lending: this would result in higher loan competition. Ally’s returns would be pushed down. We wouldn’t lose money but the upside in the investment would be gone. We think this is highly improbable given everything we discussed about Ally’s competitive niche.
The ideal time to own a business is (a) at exceptional risk/reward, (b) while the business’ competitive position and returns on equity capital are improving, and (c) where there are years of attractive reinvestment ahead. Ally checks all these boxes.
A word of warning to subscribers: for this type of cyclical business, the stock’s just not going to go up in a bad recession, and is very likely going to fall more than the market as participants rotate into safer ideas to hide during the storm. There is a good probability we will look stupid in the near term. If you believe you can time the market (which is impossible), there’s no point owning it now. This isn’t something to own if not prepared for a significant drop, and prepared to own the business for years as it executes on plan.
Chris
Thanks for your support! If you enjoyed the read, please consider sharing it below it with someone you know who might be interested.
OR! If you yourself aren’t subscribed and want to receive regular updates and new content, please subscribe free!
By the way, I try hard to avoid this by developing a clear sense early on of what it looks like the market might be missing, and hence what I should focus on and try to get my arms around, and let it go if it seems like I can’t.
It has to be like that, doesn’t it? Otherwise there’d be no investment insights to uncover!
Which consists mostly of long-duration US government Treasurys and 15/30 yr agency mortgage-backed securities
NCOs, the proportion of loans that are charged-off, net of whatever the bank manages to recover. These are the losses.
excluding unrealized securities losses
During the financial crisis, many auto loan books actually outperformed mortgage loan books even though consumer mortgages are often widely considered one of the safest — if not the safest — class of loans on a bank’s books.
Corporates drew down their credit lines to hoard cash, and parked that money back at the banks, so deposits grew.
Cash for a bank means short-term government bonds, short-term high quality commercial loans, money on deposit with the central bank, and things like overnight loans and repurchase agreements between banks and also with the central bank. It’s not physical cash under the mattress.
NY Fed Quarterly Report on Household Debt and Credit 1Q23 https://www.newyorkfed.org/medialibrary/interactives/householdcredit/data/pdf/HHDC_2023Q1
All of whom have opportunity costs of ~15-17% ROEs because of their card and other business lines: COF, WFC, JPM, BAC, and so would not underwrite loans at low rates of return.
E.g., the company’s SmartAuction software helps dealers wholesale vehicles to one another, on which Ally takes transaction fees. The loyalty program rewards dealer volume, e.g., giving Ally X loans lets a dealer take say 25bps off floorplan financing based on what Ally’s cross-sold to the dealer and what the dealer values.
WFC’s auto originations fell to $5b in 1Q23, down 32% y/y from $7.3b in 1Q22. PNC’s auto loan book is -9% y/y, to $14.3b 1Q23 from $16.3b 1Q22, also implying double-digit declines in new loan originations.
This also offsets rising NCOs as interest rates tend to fall in recession, since Ally’s NII and PPNR increases as credit losses also increase.
This $80 billion is 15% smaller than the actual book as we normalize auto originations -15% due to elevated car prices.
E.g., that the Manheim used vehicle index declines from 225 today to 175. We talked about this in the Industry section.
Given historical yields vs. 5.5% aMBS yields today in June 2023
15.5 million new vehicle sales annual run-rate / 18,000 franchised dealerships
The only other point we’d like to make about the book is that NCOs rose over 2014-2019 when interest rates rose (rising rates correlated with increasing pressure on consumers’ ability to pay other variable cost debt; it's happening again during 2H22, where Ally’s NCO rates are up now that interest rate increases are hitting consu
However, we think JPM’s business is to essentially act as the captive finco for small automakers that can’t build one. It’s white-labeled as Mazda Finance, for example. The book probably skews to superprime new vehicle loans with very low NCO rates.
Historical avg. NCOs are 1.2%, however, Ally’s loan mix now skews more heavily to prime vs. super prime, and to used vs. new vehicles.
It’s consumer, it’s 1/9th the loan book’s size, and Ally evaluates lease credits the same way.