


Portfolio Updt. Pt. 2b: BN
Because who doesn't like bonus content?

“We try to imagine we’re buying the portfolio every day.”
— Seth Klarman, CEO & Founder, Baupost Group
~20 min read here.
The last couple updates on our positions got me thinking. Facts and market prices are nudging me to add to Brookfield (BN) and sell down other things. I like to revisit the facts and my reasoning beforehand, and I thought it would make a good post. Writing this out helps the decision process, too. Win-win.
Here is our original BN summary. It’s about a year on.1 You’ve seen this table before.
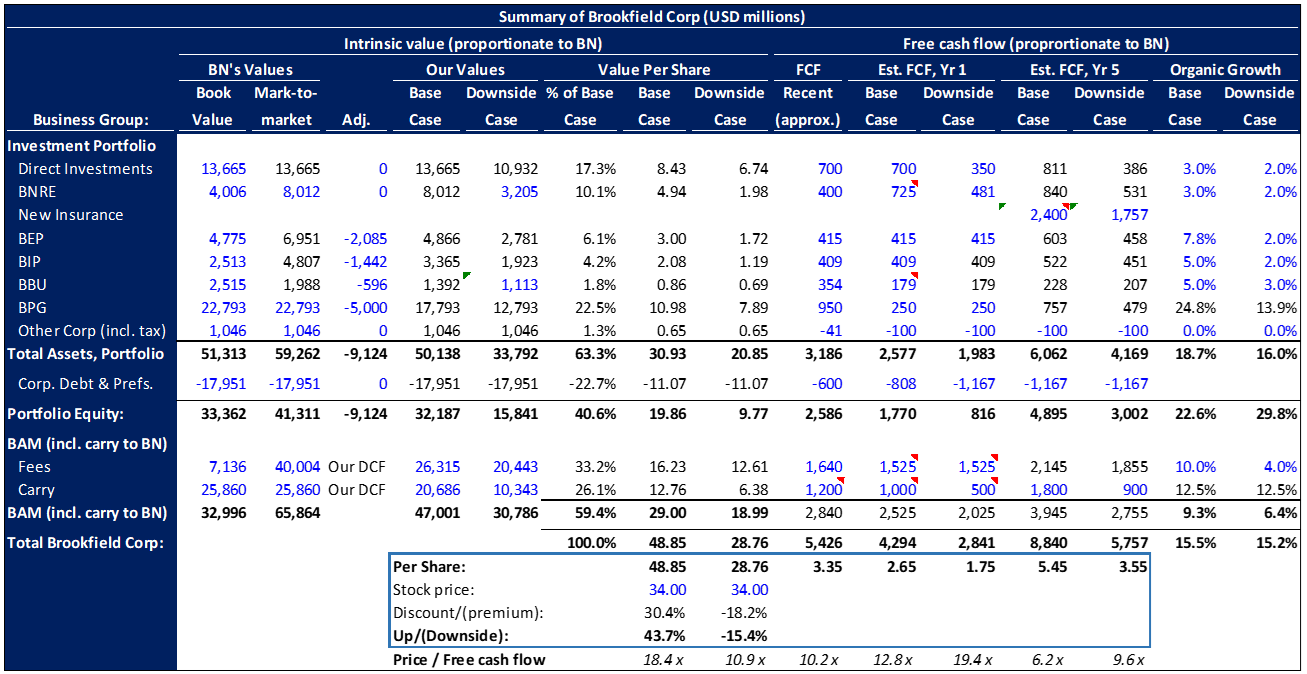
(Recall when modeling out the cash flows and including the value of reinvestment, we got ~$65/share. This table summarizes existing assets’ and their valuation & cash flow contributions, but implicitly assumes all free cash flow is distributed to us and reinvested at the cost of capital. Instead, Brookfield retains most of its cash and reinvests at excess returns on capital, creating additional value not captured in the table.)
Here is my update:

I made a chart of the “deltas” (differences) in the values to show what’s changed, hid stuff not worth talking about, then highlighted key parts. Let me talk you through it.

At the bottom of the biggest red box, you see my base and downside cases’ estimated intrinsic value per share increased by $10.20 and $8.81 vs. last year, respectively. Percentage-wise, there’s slightly less upside today, but similar downside. We’re also paying a similar ~12.5x multiple of free cash flow because of BNRE’s acquisition of AEL in May, just after 1Q24 end, which bolted on more intrinsic value and free cash flow compared to my initial 2Q23 valuation. BBU — Brookfield’s publicly-traded private equity partnership — is also growing cash flows and leveraging its debt costs now that interest rates aren’t rising anymore. Although BAM grew, I didn’t update the fee-based free cash flows because the change was within normal noise levels. We still get about $1.5 billion in fee-based free cash flows from BAM. It’s maybe 10-15% more, and so $100-150 million doesn’t matter in the context of the $5.25 billion free cash flow BN now does. That is up $949 million as shown, vs. my estimate last year, and it’s driven by BNRE and BBU.
Let’s talk about the big movers, the assumptions underlying the key parts of the business, and any important ones I changed after re-assessing.
What are my assumptions? What changed? Why?
BNRE drove ~$5.50 of the ~$10/share increase, due to the acquisition of AEL and ongoing organic growth. $8.7 billion (~$5.50/share) in intrinsic value moved into this bucket, partly out of the “Direct Investments” bucket as Brookfield funds liquidate and Brookfield re-allocates that capital (they’ve said this verbally, but don’t disclose enough to tell how much moved from where to where). The rest was sourced mainly from ongoing cash flows, including cash flow retained at BNRE to grow the business, and some debt.
BNRE and “new insurance” in the table represent the life insurance, annuity, and pension risk transfer2 business. These are stitched together from 2 acquisitions BNRE made: American National Group and American Equity Life. “BNRE” is what BN already owns. The “new insurance” line represents the incremental amount of business I expect BNRE to underwrite via those two acquisitions. I did that to gauge how much free cash flow BNRE will be making in a few years, but the estimated intrinsic value of that stuff is already included on the BNRE line. They are the same business.
In all, this insurance business is now doing $1.4 billion annually and should do ~$2 billion within 2 years without signing on a single new policyholder. New policies look like it can take the business to >$3 billion annual free cash flow in 5 years, if management executes well. The insurance market also has to co-operate a bit. That’s $3 billion out of the now ~$9 billion in total free cash flow we expect in 5 years, so BNRE will soon by the second largest cash generator in the business by far, just behind BAM. BNRE didn’t even exist a few years ago. Brookfield has invested about $10 billion to create what is today worth ~$20 billion. To meet its underwriting targets, Brookfield will need to invest a further $9 billion, driving ~$1.6 billion in incremental profit. You see this in the “new insurance” line in the second table. In a few years, this business will be doing ~$3.6 billion in profit and be worth something like $30-50 billion, for a $19 billion investment. In the worst case, even if BNRE can’t drum up new business, we are left with a $2 billion earnings stream worth ~$20 billion, which BNRE paid $10 billion to create. The two insurers BNRE bought to build this platform are looking like a home run use of capital irrespective of the outcome.
(Note: if you read Brookfield’s presentations, filings, and supplements yourself, this business is now called “Wealth Solutions”. It’s the same.)
Next driver…
BPG & direct investments: BPG drove ~+$2, mostly because I reduced my write-down Brookfield’s office real estate portfolio. Direct investments declined $1, which looks like run-off (liquidation) of Brookfield real estate fund investments alongside clients.
At BPG, the facts haven’t changed. Incremental data are strong. My assessment of the facts changed, though, mainly around the $5 billion office real estate write-down in my original valuation.
(To reiterate what’s gone in office markets: the pandemic drove work-from-home, causing lower lease renewals by tenants as their leases rolled over, meaning higher vacancy. For example, vacancy in NYC peaked in the high teens, and the US/Canada/Australia were hit hardest by work-from home. Higher interest rates also squeezed landlords as their mortgage payments rose, as offices usually have variable-rate mortgages from banks.)
BPG’s got $22 billion in real estate. In the $12 billion Direct Investments bucket is another ~$7-9 billion via Brookfield funds alongside clients.
BPG is a $14.6 billion “core” portfolio, and an $8.3 billion “transition and development” (“T&D”; buy-fix-sell and construction projects) portfolio. ~$7.5 billion and $2.7 billion of the core and T&D portfolios are offices. In Direct Investments, I estimate ~half the real estate is office, or $4 billion. So that’s $7.5 + 2.7 + 4 = ~$14 billion in office real estate, or $11.60 per share. The other real estate is mostly high-quality malls with no further COVID overhang, and a small amount of residential real estate, where the housing market is tight anyway.
We originally paid low-$30s for the stock and valued it at up to $65. Clearly we’ve always had a big exposure to this $11.60/share office real estate problem.
A few office towers in Manhattan, NYC (such as One Manhattan West) make up ~half of the “core” office portfolio, and they tell well the story of what’s going on.
They are functionally new and high quality, and so are performing well. According to Brookfield, 90% of Manhattan’s vacancy is concentrated in the bottom 30% of square footage (Brookfield ranks towers by quality internally). Industry sources like CBRE slice the numbers differently but come to the same conclusion. Why?
In these commodity-like industries, you want to pay attention to supply, and second think about demand. I don’t have a good construction chart, but suffice it to say a lot of new supply came to market during the pre-pandemic period when there were both low interest rates and GDP/employment growth. When work-from-home hit, that revealed the overbuilding problem.
Here is “net absorption” — an industry term — across the US, from the start of the pandemic (2Q 2020) to the end of 2023, per Brookfield. Net absorption is intuitive once you get it: it’s the change in square feet leased minus the change in square feet vacated over a time period. It’s how many new square feet got leased or re-leased, minus how many new square feet didn’t, so it’s the overall change in occupied square feet. That also means it accounts for the underlying change in supply. Brookfield breaks this down by building age:
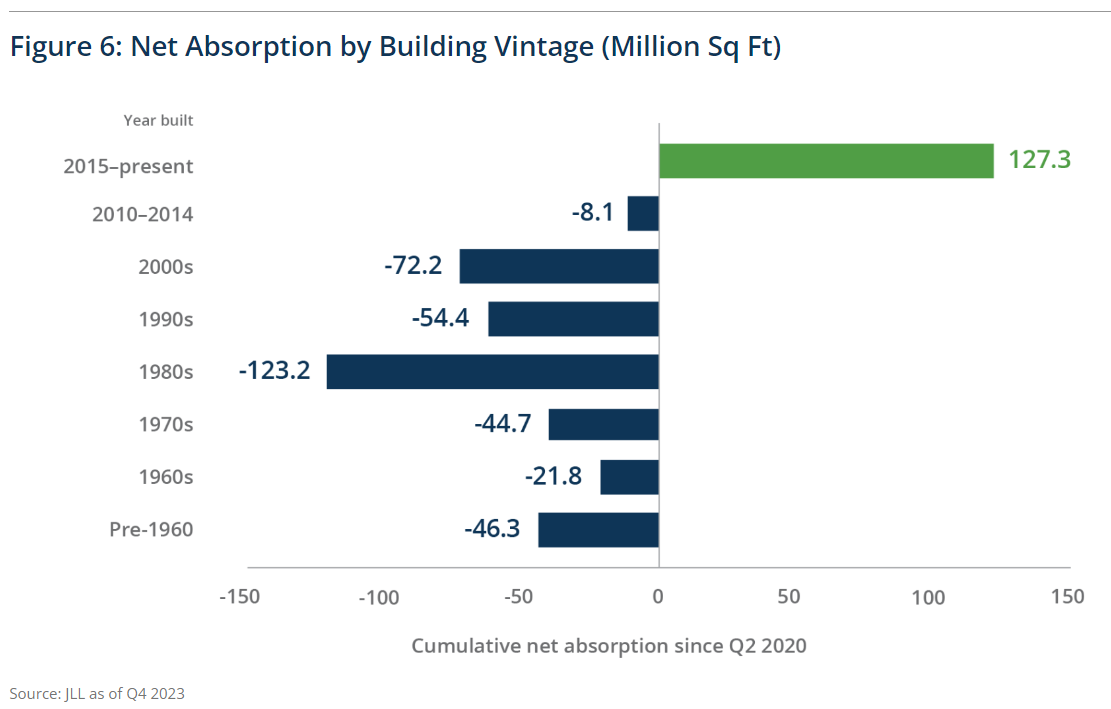
Add all the numbers first: -243.4.
So, since COVID, 243 million square feet have been vacated across the US, net. That’s from a combination of more new towers being finished than demolished/repurposed, plus a decline in demand.
Now look: towers built after about 2010 have done fine getting tenants. They leased 127.3 - 8.1 = 119 million net new square feet. Since the data is from 2020 onward, it only includes construction that finished within the 2015-present bucket, implying those towers are being filled. You can’t go back in time build more in the 1980s, so the chart also shows towers from this vintage became more vacant, by -123.2 million square feet.
So: on average, newer buildings took market share and grew in a market that shrank.
Work-from-home gave tenants the opportunity to trade up into properties that landlords kept competitive. Many older properties with few amenities are suffering. New York City’s comptroller comes to the same conclusion as Brookfield and CBRE (cities have an incentive to care since they earn property tax revenues).
There’s about 450 million square feet of space in Manhattan, of which ~17% (~78 million) sits vacant. Roughly applying Brookfield’s math, 70 million sqft of empty space sits in the worst 135 million sqft of buildings. That implies 50% vacancy. This leaves 8 million sqft empty in the best 315 million of space, implying only 2.5% vacancy. That agrees with the mid-to-high-90% occupancy rates Brookfield is reporting to us its Manhattan towers.
Key properties which make up most of our $11 per share simply aren’t seeing any issue at all as tenants take the opportunity to trade up.
It also looks like we have passed the market nadir and are on the up-swing: vacancy in NYC is now falling, while new office supply is grinding to a halt. In the 5 years ended 2023, there was on average 10.2 million sqft under construction annually. By 2022 year-end, it was 2.3 million. By 2023 year end, 1.1 million. That’s 0.24% 2023 supply growth. We don’t know market demand growth (it’d be 0-2%), but it doesn’t matter: a building lasts 50-100 years. There are already many NYC towers in this bracket, and in other cities. That means 1-2% of the supply has to turn over regardless. So we aren’t even replacing what we need to replace.
Clearly, the market is going from “grossly oversupplied” to “tightening”. Net absorption in NYC has been positive for a few quarters now. Outside a recession, that should continue. And once a recession ends, it should continue. Either way, conditions look good.
(These cities lose a mid-single-digit percentage of their office workforce in a recession because of layoffs, but this lasts 2-4 years only and we get back to economic expansion.)
I no longer believe the $5 billion base case and $10 billion downside case write-offs are justified at BPG. What I did was clearly too conservative.
There’s only data to indicate that some of the T&D office portfolio — 45 US properties — may have issues, as occupancy is low and debt is high. These are worth $1 billion to BN. I continue to write these off, plus 25% of the $4 billion worth of offices in Direct Investments. A $2 billion write-down in total. You see that on the BPG adjustment line in the table above. We now better understand why the core portfolio’s doing so well.
Finally, because that market segment’s tight, rent and operating income are rising. Higher revenue and operating income produces “financial leverage”, helping to overcome higher interest rates and interest costs these towers are paying on their respective mortgages. I think that even if interest rates rose a few percentage points from here, these properties won’t have significant issues. Rents would rise in turn, (a) because of the trade-up effect going on above, and (b) because the higher cost to build and finance an incremental office tower construction project means no one will build until market rents rise to justify it. Higher rates would exacerbate today’s problem of a lack of trophy office towers.
(In some cases, I don’t think certain properties are generating net cash flow, but I know factually that Brookfield has several ways to fund any cash crunch.)
This lower write-off changed our BN valuation by +$2/share in the base case, and +$3 in the downside case. Our current $2 and $5 billion write-offs may still prove too conservative.
Third driver…
BAM: Brookfield Asset Management increased in value by ~$1.75, mainly due to the roll-forward of the business and the model through time. That is, BAM grew and generates more expected free cash flow going forward vs. last year.3
BAM is BN’s largest business by value and biggest cash generator. We went over how it’s performing recently, so I won’t repeat it. Here are the unchanged assumptions:
Fee & AUM growth: ~10% in the base case, falling to 2% over 15 years, as BAM and other leading alternative asset managers continue to take share of the global investor wallet. In the downside case, I assume 4% declining to 2%, essentially implying there’s no opportunity left for the industry to take wallet share (i.e., my thesis doesn’t play out). Instead, BAM only gets the growth in global wealth. Today, the evidence points to the downside case being false, and to the base case being true. I implicitly assume flat pricing (fees = ~1.01% of AUM), as the firm’s investment performance (value proposition) stays strong.
Carried interest: I assume ~15% growth in carry for 5 years. Carry lags AUM and fees. Fees turn on when a new fund is raised. Then, ~5 years later, that fund starts liquidating investments to realize profits and carried interest. So the last 5 years’ fee & AUM growth is a good proxy for the next 5 years’ carry.4 From year 5, I then mirror my fee growth, lagged 5 years (i.e., year 6 growth in carry is the same as what I assume for year 1 fee growth). To calculate carry there’s a fund performance assumption in here. I’ll just say it’s a bit lower than BAM’s historical fund returns because asset valuations are elevated today.
Margins: I assume fee-related margins increase from the mid-50%s to 58% as BAM leverages its recent investments in distribution (salespeople/reps and related support staff in the wealth management channel). Scaled competitors are all ~60% margin businesses.
Fourth and last driver…
BIP/BEP/BBU: the 3 publicly traded partnerships BEP, BIP, and BBU drove ~$2.50 together. I’ve decided to mark these down less than previously (often ~15% base case instead of ~30% previously; mainly to account for volatility in when BN might be able to sell).
Conclusion: the margin of safety and the risk/reward to me still feel more than adequate quantitatively.
Even if you chose to ignore the degree of mark-down in the 3 partnerships, and kept the high write-off in BPG, base case intrinsic value still increased ~$7.25, to ~$56.25, from $49 last year (excluding the value of reinvested cash flows).
If you model in the value of reinvestment at BN, the new base case intrinsic value is $80. There’s a range around that, frankly, one that I think skews down a little. But that’s still huge upside vs. the low $40s today. So call it $56-83 in the base case, or 35-100% upside, vs my $37 downside. Even if the real estate or some other business turned out worse, the risk/reward is still exceptional.
Qualitatively, I know this business and industry very well, understand the management, their approach, and their track record very well, and can see the runway ahead of them very well; I know the cash flow profile well and the quality of the underlying assets in this conglomerate, and have a good sense of the range of outcomes. The evidence continues to track to my thesis. I also believe the industry leaders are positioned well for many years and believe the industry is very unlikely to be disrupted. I’m happy to own more than a >25% portfolio weight.
Finally, consider the 5-year IRR if we bought the stock today and it never traded at a fair multiple (~18-26x free cash flow). Say it sat at 12x. BN would be doing ~$6/share in free cash flow in my base case, x12 = 72, for an 18% IRR (rate of return) including dividends. To make only 10%, it’d have to be trading at 8x, an absurd price for a business with BN’s characteristics.
Every way I look at it, the stock is still a good idea today.
(Obviously, if there’s an immediate and severe recession, this stock is probably going down. I don’t invest this way. And unless the thesis is broken, the risk/reward is just going to be better.)
Takeaways
Take a couple things from today.
Know the business’ value proposition well: understanding a business’ value proposition matters a lot. Look at BPG’s office real estate holdings. Their comparative quality and desirability in the market is helping BPG maintain very high occupancy rates in these towers (~95%, significantly better than the background teens vacancy rates in many of these cities). By contrast, you saw that landlords who failed to improve their properties or who own property in less desirable locations suffered the most when there was suddenly a slowdown in the market (driven by a work-from-home “regime change”). It’s important to understand the relative value proposition of a business vs. its competitors — i.e., why customers choose its product/service and not others — in many investments. I had a hint that BPG’s properties were good when I initially bought BN, and the evidence now coming in confirms that, while teaching me more about what matters in real estate.
Update your thinking using an objective method to avoid behavioral biases: like this article’s opening quote from Seth Klarman says, maybe you can imagine that you are buying all these stocks right now. Ignore the price charts, too, since the chart doesn’t tell you what the business is worth. Focus on today’s price, as if they just IPO’d. At this price, given today’s facts, would you buy these stocks or sell them? What weights in the portfolio should they be? Etc. Otherwise, you can get stuck with unproductive thoughts that aren’t rational and objective, like “well the stock just went up a lot, I don’t want to buy it anymore. I’ll wait till it falls [because I think that I can predict stock prices].”
But wait, there’s more! You get another bonus section this week!
Funny Business
Here’s an entertaining but practical quandary for you.
Firms like Brookfield must use a third party to double-check their work and value any assets that are marked to market or marked to model. In Brookfield quarterly reports, you will come across the following (emphasis mine):
“We test the outcome of our process by having a number of our properties externally appraised each year, including appraisals for core office properties, at least on a three-year rotating basis. These appraisals, along with market comparables and third-party valuation metric analyses, are used to support our internally-prepared valuations; significant differences are reconciled as they arise. During the three months ended March 31, 2024, we obtained 9 external appraisals of our operating properties representing $4 billion of assets; external appraisals were within 1% of management’s valuations.”
You’ll consistently see the last sentence written this way every quarter. Can you see the problem?
If you haven’t laughed yet, here’s the head-scratcher: how is it that Brookfield hires a guy like KPMG, who checks Brookfield’s numbers independently by doing their own work, and yet every single time they come within 1% of Brookfield’s — their customer’s — valuation mark?
Simple, right? KPMG wants to keep getting paid. They’ll do whatever Brookfield says. “Hey uh, KPMG, one of your assumptions doesn’t look right, according to our own analysis, it’s this. Here’s why. Can you fix it? Thanks.”
(Isn’t it crazy how incentives rule the world?)
This should put you in a pickle: is Brookfield just making s*** up? What do?
In distrust, some people solve this by marking all Brookfield’s holdings down a bit. That’s a dumb solution. Like we’ve talked about several times, most of this company’s future value depends on management execution. If management can only earn 8% incremental ROEs on all the free cash flow it retains, this will be a bad investment.
So, you can’t both:
Trust the management and buy the stock because it’s cheap and doesn’t reflect the value they are able to create, and
Distrust the management and mark down the assets.
Dude. Do you trust Bruce Flatt or not?
I personally believe “just tell KPMG what assumption to put in” is the extent of the funny business going on, and don’t think it’s malicious.
I have a few facts and stories backing it. For example, Brookfield knows in real time the replacement cost of any building in any major market in the world, and they know a lot about every single building in several major markets like NYC. They also know decades of history about real estate market cycles throughout a variety of supply-demand conditions, recessions and booms, and interest rate environments. They have both a huge cross section and time series of data, and I believe they’re data-driven decision makers. Brookfield knows way, way more than almost anyone about real estate, and kind of has the right to tell KPMG what to do.
Obviously, it doesn’t mean the valuation marks can’t change. They reflect only Brookfield’s current expectations. Maybe they badly screw up a private equity investment and it turns out to be worth zero. On the flip side, they also can improve a company more than expected halfway through the holding period, and have to mark the asset up. Each major bucket in my summary above contains tens of individual investments, though, so that will tend to average out in time. The largest risk to BPG’s marks is a big rise in interest rates without a corresponding rise in inflation and rents. In that world, the present value of the assets falls because the cost of money rises and isn’t offset by higher future revenue and profit expectations. Interest rates and inflation can de-couple a bit, but if you look at long-term history, they tend to move together.
I mark-down BEP, BIP, and BBU because BN can sell shares in them at any time to fund other investments, and might do so at depressed prices for the right investment. You can argue this is still illogical since they’d only sell the positions to buy a more undervalued asset with the money. However, you can also argue a few of these investments can go a**-up at any time for reasons nobody can foresee, too. KKR thought it had a really solid investment in an ultra-stable surgery center business, only for a pandemic to happen, force lockdowns and delay surgeries, send the business to $0 revenue for a few months, and push it into bankruptcy.
It’s clearly worth thinking through how you should value this stuff, and why. “I’ll just take a haircut off someone else’s value” is a head-in-the-sand approach, in my opinion.
Chris
I bought the stock before starting the this newsletter blog, summer of 2023.
Pension risk transfer is where a life reinsurer approaches a corporate defined-benefit pension sponsor, say General Motors, and buys the GM autoworkers’ pension assets and liabilities from the company. They get all the investments, and they assume all the future liabilities paid to the pensioners when they retire. Because the pension is defined-benefit, the payouts — the cash outflows — are more or less “fixed” already, so a buyer like Brookfield can then try to make a profit by increasing the projected returns and cash flows from the asset side of the pension, without taking undue risk.
Keen readers might see the valuation changed but my baseline cash flows didn’t. There’s a separate valuation I go through and the numbers don’t quite connect for… reasons. I’ll change my modeling in the future.
My modeling is a little more complex than this, but this is functionally what it’s like.