


Brookfield & KKR -- "Good Businesses"
And the anatomy of good risk/reward

“The best business is a royalty on the growth of others.” — Warren Buffett
It’s been a minute, but we’re back at it! ~20min read here.
I know what you’re thinking: “IT’S NOT A POST ABOUT BANKS?!”
I know. It’s crazy. Don’t think you can relax: we’re still talking about boring, complicated financial companies! Yay! The beatings will continue until morale improves.
(By the way, you have no idea how much pleasure it gives me to write for you. Not to mention the clarity I get from being forced to think about and communicate our investments clearly.)
KKR and Brookfield reported their earnings a few weeks ago. Because I haven’t posted anything about them and I promised I would, we’ll focus first on:
The basics of the business model
A little on the industry, what’s going on, what the long-term opportunity is, and
Where I think these two competitors will be in that future state and why I think their businesses are getting better with time (i.e., widening moats)
The Basics of an Alt. Asset Manager
The product and the business model are simple.
Alternative (alt.) asset managers like KKR and Brookfield invest clients’ capital. Clients are mainly large institutions like pension funds, sovereign wealth funds, etc. The “alternative” part is from the fact they don’t invest in public stocks and bonds. Instead, they invest in “private” assets like:
Real estate, such as data centers, office and residential towers, warehouses, etc.
Infrastructure, such as ports, pipelines, toll roads, power generation, etc.
Private equity. This is where the industry started, and is businesses of all kinds: healthcare providers, software, manufacturers, business services, consumer products, etc.
Private credit. This is debt borrowed to help finance buying the 3 above, plus other loans such equipment, inventory, and real estate loans, etc.
The process works like this. The manager:
Identifies investment opportunities and starts a fund like a real estate credit fund
Gathers capital from clients it has sales relationships with
Uses a team to evaluate and buy businesses with the money
Executes on an investment thesis for each business (such as extending a product line at a manufacturing company, or cost reduction initiatives, etc.)
Executes on the thesis then sells the business to another owner
Returns funds to clients after trying to earn an attractive return. Many private equity funds target 15-20% returns. (Though many don’t meet this return, by the way. It’s not an easy game, and it’s competitive.)
Closes the fund and starts again at #1
That’s the traditional model, though there are “perpetual” funds where the capital isn’t returned. It gets “recycled” into new investments as the manager does its buy-fix-sell. All Brookfield’s “publicly traded partnerships” are like this, for example. You can buy shares of Brookfield Infrastructure Partners (BIP) on the TSX while Brookfield reinvests into new opportunities indefinitely. You sell by selling your shares to someone else. Brookfield doesn’t redeem them. In the traditional funds above, you can’t sell (broadly speaking). You get your money and profits back as the fund liquidates the investments.
The manager’s model is a fee-based business. It takes:
A management fee: a percentage fee on the clients’ assets they manage. It’s usually 0.75-2%; and,
A performance fee or “carried interest” or “carry”: a percentage of the excess profits they make, usually 10-20% of profits upon exceeding a “hurdle” rate.1
For example, if one of KKR’s funds was $100 million, had a 1% management fee, 20% carry, and was making 10% annually on clients’ money above a 7% hurdle rate, then the fund’s annualized revenue would look like:
Management fee: 1% fee * $100 million = $1 million fee revenue
Carried interest: 20% carry * 10% returns * $100 million = $2 million carry.
In many instances, the fees are charged on the initial amount clients commit, not on the market value of the fund. This makes the management fees revenue rock-solid over an ~8 year period where the money is locked in until investments are liquidated. It’s extremely sticky and recession-proof.
There’s more nuance, but broadly speaking, that’s how the business works.
The economics are fantastic. Once they have scale, industry leaders do 55-65% operating profit margins. As the funds scale up, you don’t need to add as many more investment people or overhead; you just do bigger deals. You also don’t require any reinvestment to grow because it’s just a bunch of smart guys in offices buying, fixing, and selling businesses. There are no factories to build. There’s no R&D. Marketing spend is low because it’s a handshake business. Thus, nearly $0.50 of every $1 revenue becomes cash profit, and they don’t need to hold onto any of that $0.50 to grow. Alphabet’s Google ad business looks bad by comparison.
Although simple, Brookfield and KKR have very complicated financial statements. They’re so bad that both companies provide re-cast financials and metrics for you, which you have to verify isn’t BS, and then you can use them (and can throw the GAAP/IFRS financials in the garbage because the fund accounting rules are awful).
The reason for the complexity is a “Yes, But…”
Yes, these are asset-light businesses that don’t require investment to grow (like a consulting firm). Hence, they’d normally pay out everything as dividends and buybacks. Most businesses like this have simple financials.
But, KKR and Brookfield both retain ~80%+ of profits. Instead of paying the money out, they plow it back into their own funds and investment deals alongside clients. They’re compounding the money for you. Over time, they accumulate investments. They start looking like holding companies with ownership stakes in different stuff. 34% of a toll road here, 62% of a healthcare company there, sprinkled on a portfolio of commercial loans, some investments in 10 funds, etc. It gets complicated, fast.
All that’s happening, though, is Brookfield and KKR are reinvesting for you. Those investments earn interest and dividends and get sold for a gain or loss. That money, plus the profits from the asset manager, get plowed back into yet more investments. The compounding machine compounds.
With a little math and a lot of judgment, my estimate is it’s reasonable to expect ~12% returns on their investments (coincidentally at both companies, but for different reasons). The retained profits are creating value since your opportunity cost is maybe 9%. I also believe they are not taking outsized risks, that they are prudent, and that they’re investing mainly in areas they’ve already demonstrated they’re good at and have been thoughtful about. I wouldn’t own these stocks otherwise — if they are holding onto most of my money, I need to know there isn’t a big risk of bad capital allocation and the value destruction that comes with.
So, overall, think of Brookfield and KKR as (1) a diversified alt. asset manager investing across many kinds of private assets and taking fees for it, and (2) a portfolio being built through retained profits and compounding your money for you.
The Alt. Asset Mgmt. Industry
This is a big industry with ~$12 trillion in client assets under management (AUM). Excluding the hedge fund industry (where Brookfield and KKR are hardly present), growth is ~10% annually and should continue at >GDP for years if my thesis holds.
Why?
Alt. investments make up on average ~25-30% of clients’ portfolios today, up from ~5% 25 years ago. The sophisticated guys who pioneered this, such as Canada Pension Plan, the Yale University endowment, and others, have alt. asset allocations of 40-60% already. There’s a clear goalpost for laggards.
The reason most institutional investors should get there is that, compared to stocks, the risk/reward on most alt. asset classes is better (assuming you’re invested with one of the good managers). Private equity returns are higher, and the risk is similar to stocks. Infrastructure returns are similar to stocks, while measures of risk are less. At the same time, owning a collection of those assets, like having large allocations spanning real estate, private equity, infrastructure, etc., also provides more diversification than a stock-and-bond portfolio does.
It’s not just woo-woo: the portfolio losses are lower, as the different parts of the portfolio aren’t as correlated to each other as a stock-and-bond portfolio. Many of these individual assets also see losses smaller than stocks in bad times.2 For example, infrastructure assets are less correlated to the other asset classes than any of those assets are vs. each other, yet the cash flows and rates of return are similar to (but more stable than) stocks and so they also fall in value less. So there’s a clear place for infrastructure in most large institutional portfolios. It’s the case for the rest, too.
This more efficient portfolio is driving most institutions and wealthy individuals to steadily invest more and more into alternative assets.
With a clear pathway and reason for the global asset allocation to move toward ~50% alternatives from ~25% today, that can double the industry in 10-20 years. That’s 3.5-7.5% annually as alt. managers gather up more of the world’s wealth.
I could put a cool chart here. Honestly, just remember this about the market penetration tailwind:
~5% in the year 2000 —> ~25% today —> ~50% in ~20 years
Clients’ portfolios are also growing ~4%+ as they earn returns (interest, dividends, and capital appreciation) while their percentage allocation to alts is also growing. Putting together overall wealth/economic growth plus the ongoing shift to alternatives, it’s reasonable to believe in 6-11%/yr industry growth. Historically, it was ~10%/yr. The future pace should be slower since there’s less percentage growth from 25% to 50% (a double) than from 5% to 25% (a quintuple).
Competition, and why KKR and Brookfield are industry winners:
There’s a lot of fragmentation. Despite being among the biggest with ~$500 billion AUM each, KKR and Brookfield have single digit market share globally (of that $12 trillion above). There are probably >500 competitors.
At the top end are 5-10 global, scaled, alt. asset managers who dominate the share of wallet with the largest clients (like Texas Teachers Pension, PIF the Saudi sovereign wealth fund, South Korea’s National Pension Service, etc.). These are Apollo, Blackstone, KKR, Ares, Brookfield, EQT, Carlyle, Partners Group, and a couple others. Each manages ~$0.3-1.0 trillion. In the last decade, they diversified to become a “one-stop-shop” for clients. They can sell to the Saudi PIF or any client:
Real estate equity and credit investments
Infrastructure equity and credit
Private equity (across geographies and industries)
Private credit (opportunistic, liquid, and illiquid)
And more
Want an infrastructure investment portfolio with nice stable businesses like toll roads? They’ve got you. Want private equity investments in opportunistic turnarounds of mid-sized companies? They’ve got you. Want equipment loans, real estate loans, or bank loans? They’ve got you. Want them to help you build an efficient portfolio that combines several of those smartly? They can help you there, too.
20 years ago, KKR mainly did private equity. During and after the financial crisis, it expanded into all the above and was successful in every area. Brookfield’s starting point was mainly real estate and mainly its own money, but it also successfully diversified into a multi-asset alt. manager.
Today’s industry leaders were the ones that succeeded at all this yesterday. Now, it takes 20 years to replicate a 20 year investment performance track record and show the clients you’ve got winning products.3 And you’ve got to do that across your entire product line if you want to win as much wallet share as you can. Most competitors failed or didn’t try because it’s hard to generate strong performance across different asset classes and for a long time.
As long as they’re performing well across funds, there’s no need for a large client like PIF to look for 5 other money managers, too. You just go with a few of these guys.
That all means these winners are incredibly hard to dislodge unless they screw up big.
Both KKR and Brookfield have been relatively consistently doing well long-term across the majority of their funds (and I know enough about their investment processes and opportunities to believe that’ll continue). They’re growing in line with or faster than the industry in each of their business segments. Because of their strong value proposition — a performance brand and “one-stop-shop” for all needs — they’ll continue winning out in an industry growing at an attractive clip with a long runway ahead as the industry doubles or triples in size.
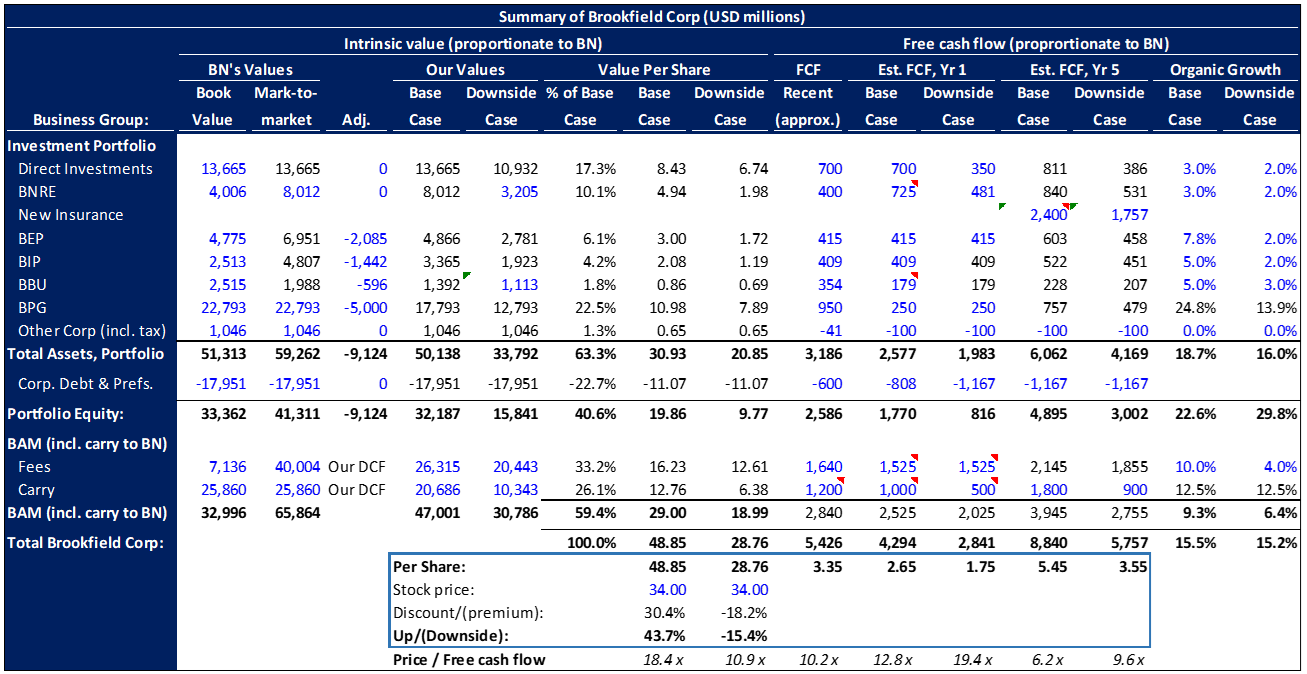
Valuing these businesses
For a report, I built what many call a “sum of the parts” for Brookfield (BN) below. Don’t fall for the old investment banker trick and get mesmerized at fancy numbers and take them as a firm statement of value or of the future. Consider them a guidepost and consider a range of outcomes, which is how I think about the company.
When researching Brookfield, I decided what matters and what doesn’t. I spent very little time on BBU (Brookfield Business Partners, the private equity business) because it’s 2% of the conglomerate’s enterprise value.
First, I spent the most time on — and have the highest conviction in — the value of the asset management business, Brookfield Asset Management (BAM). The parent, Brookfield Corp (BN) owns 75% of BAM, and it’s ~60% of BN’s equity value.
BAM is worth the present value of the two levers we talked about earlier, the free cash flows from (a) management fees and (b) carried interest. Combined, I estimate they’re $29/share in my base case above. I didn’t just take the share price of BAM. I value BAM’s cash flows, based on what fee growth is plausible for it, and what carry it can earn based on how good I think BAM is at investing. There’s a range around $29, but I think that’s what’s reasonably achievable. I used ~6% average growth for 15 years, at which point the market opportunity we talked about looks like it will be exhausted and these businesses will grow at ~nominal GDP thereafter. BAM could very well do better, and has grown faster than what I would have expected historically. If I am wrong to the upside, that’s fine with me. Management’s own business plan is more aggressive than what I modeled, and management has historically often hit their targets.
Brookfield Property Group (BPG) is #2. It’s 100% owned, and is mostly large, high-quality malls and mixed-use downtown office real estate. It’s some of the best in the world, located mainly in New York, London, and Toronto. You can see I’ve written off $5 billion in my adjustments above, which is ~50% of the ~$10+ billion office portfolio within BPG. Work-from-home plus pressure from higher interest rates on office mortgages are together putting big pressure on the industry. It’s very tough in North America, with some cities at 20%+ office vacancy rates. That’s a little worse than the prior bubble which burst in the late 80s and early 90s. By the nature of their workforces, San Francisco and New York City have both been hit very hard. Over 70% of Manhattan’s offices were 90% leased or more before COVID. Today, only ~45% are >90% leased.4
In real estate, it takes several years for the market to clear as the weakest properties default, banks take losses, new owners recapitalize and/or repurpose that real estate, and demand growth sops up the rest of the excess supply. It looks like we’re approaching the halfway mark in this “shake-out” phase.
Though I’ve written off 50%, only a few older, poorly located, less valuable towers have defaulted, just over 2% of the BPG portfolio. About 20% of BPG’s offices (by value) are of lower quality. BPG’s most valuable holdings are new or renovated, well-located, and are mixed-used with amenities for workers, and these are ~80% of the portfolio. ~1/3rd of their square footage has re-leased since COVID started. Despite that, occupancy is up 0.1% since 2019, at just over 95%. If 30-35% of your space turns over and is renewed by new or existing tenants and your occupancy stays flat, that’s a strong signal of these properties’ quality. Their rents are also up while rents in other struggling offices are flattish or even down. Higher market vacancy rates are concentrated in less desirable buildings. BPG’s properties will mostly survive, and my $11/share estimate and 50% write-down may prove too conservative. BN’s stock is down partly because of this problem, but the evidence indicates the market’s painting BPG with way too broad a brush.
Third, the “direct investments” portfolio is also ~60% real estate and includes some unknown amount of office, maybe up to $3 billion of the total $10. A write-down for this is included in the $5 billion write-down in BPG we just talked about.
BEP and BIP, the energy and infrastructure partnerships Brookfield has interests in, have nothing wrong with them. Their debt is mostly fixed rate and long-duration, and their revenues are mostly contractual (like pipeline take-or-pay contracts) and indexed to inflation. They are doing well despite inflation, higher rates, and a slowing economy. Brookfield’s executives have allocated capital well in these segments and I estimate they’ve earned a combined 15% return annual internally over the last 10 years. The two are worth $5+/share.
BNRE, the annuity & life insurance business Brookfield acquired and is expanding, will grow to being BN’s #2 in the next 5 years. BN is allocating most of its new and recycled capital into BNRE, including sales from BPG and the direct investment portfolio. BNRE’s returns on capital should increase from ~10-15% to ~20% as it fixes the investment portfolios in the insurance businesses. That means most of BN’s capital is now being reinvested at 20% returns, which is very accretive to us.
BNRE today has $100 billion in assets and $10 billion in equity capital, and in 5 years the company expects to have invested a total $20 billion as it grows to $200 billion in assets against the insured retirement liabilities it acquires (the life insurance industry overall has $ trillions in assets). BNRE will be earning up to $4 billion annually in 5 years (by management’s estimate; ~$3.24 by mine above, where you see $840 + 2,400 million) on that $20 billion.
Without going into detail, the logic behind getting there is sound and is mostly about improving the portfolio by utilizing private markets and other investments that many competitors can’t access (and who mostly buy corporate bonds instead). There’s also precedent from competitors like Apollo who already did this. Brookfield is also one of the best run companies (in terms of successful execution and smart capital allocation) among any I’ve looked at. The management team is very shrewd, doesn’t take outsized risks, and has a good batting average, so I’m OK with getting behind management’s bet.
This is the compounding and capital allocation machine at work, as Brookfield allocates dollars toward growing, higher-returning businesses and away from less attractive opportunities.
Overall, I estimate Brookfield will be doing up to $9 billion in free cash flow in 5 years (~$5.50/share) if they continue to execute on levers like BNRE. BAM also continues to grow at a good clip (+8% in 3Q23 vs. 3Q22) despite the macro headwinds we talked about, with recent fundraisings going very well. Some competitors have stopped trying to raise funds at all right now, again showing you the power of BAM’s record and position — its brand.
If Brookfield’s execution is poor, they’ll be doing closer to $5.5-6 billion (~$3.60/share) instead, not much more than the ~$4.5 billion ($2.65/share) it’s likely to make this year.5
I won’t earn a good return in that world, but I don’t think our investment will have a big impairment, either, since we paid $34, or about 10x those average 5 year earnings in our downside case.
That makes the risk/reward compelling. Heads, I win big. Tails, I don’t lose much.
For a second approach to valuation, I ran a DCF on the combined business. I assumed a 16% incremental ROE for 15 years (a blend of the 12% in the investment portfolio and very high 30-60% returns at the asset manager, plus a time horizon representing the runway I think Brookfield has). I also assumed all cash flows above the existing dividend rate were reinvested at that 16%. That comes to a value around ~$64/share.
So In all, I estimate that if they continue to pull the levers they’re already pulling to build value, the business is worth $45-70 today and is growing its intrinsic value per share at something around 15% overall as BN reinvests most of our profits back into BNRE at 20%, and BAM grows at a good clip.
From a relative value point standpoint, KKR and Brookfield grow faster than the S&P 500 index, earn slightly higher returns on capital, have better reinvestment rates, and trade at almost half the valuation in terms of price to free cash flow.
What’s going on now, and where to from here?
Industry growth is cyclical. Right now, we’re in a slow period: the industry is having a tougher time raising money and making deals to put that money to work. For example, in 2021, KKR raised $121 billion in capital. In the 12 months ended 3Q23, they’ve raised $54 billion.
Why?
First, there are fears of upcoming recession. That makes clients more cautious to allocate, and it also makes for less deal-making as sellers who aren’t distressed hold onto their businesses for better pricing, while the buyers disagree and try to price in recessionary conditions.
It’s also slow because clients’ portfolios recently lost more in their bond and stock holdings than their alternative asset holdings, and so they’re not urgently trying to “re-up” to get back to their target asset allocations. If you have 25% in alts, and 75% in traditional assets and your traditional assets fall 20% but your alts are flat, then you now have 29.4% of your portfolio in alts. Maybe your target was 27% and you might have been looking to add, but now you’re not.
It’s possible there’s a soft landing and we are going to be seeing acceleration next year. It’s also possible economies worsen and it will take 2-3 years for fundraising and deal-making conditions to improve in the next economic expansion. This affects KKR more than Brookfield because KKR skews more to private equity where the businesses and deals are more cyclical, while Brookfield skews to infrastructure and renewable energy investments that aren’t cyclical (and where clients own less infrastructure than they do private equity, and want to add more infrastructure). Brookfield is actually still humming along and BAM is growing ~8% even in the current environment. KKR’s has slowed to 6%.
This said, both companies are doing an excellent job exploiting their leading industry positions and brands. They’re also pulling other levers to continue building the value of the businesses. Both, for example, continue to invest heavily into growing their annuity insurance businesses (a market that’s doing well right now with higher interest rates). Gathering insurance “float” (by writing insurance policies and collecting premiums) allows them to take that float and invest it into their own investment funds at a time when clients — the traditional source of capital — are more cautious and have less to give.
So money’s just gotten tighter, and that’s why these stocks are down in the last 2 years.
I never added to either position in 2021 when conditions were very frothy, although I didn’t sell either (which, depending on your time horizon, is either a mistake or not a mistake). I bought KKR in 2019 when things were average (but the stock was priced for worse). Then I bought Brookfield (BN) this year, as things are again slow. BN, you saw, also has its own company-specific problems like BPG casting rainclouds over the narrative. I sold some things to buy more KKR this year at $45 & $55, but decided BN is the better risk/reward, has stronger tailwinds, and is a little better managed (at least in terms of the type of CEOs I like). I’d also like to own more than one of the winners to avoid some idiosyncratic risk I can’t foresee, since combined they are my largest position at ~40% of the portfolio. I’m OK with the 40% because each business is “internally diversified” across many different assets. For example, the asset management business at each company is only ~50% of the total value while the rest is a diversified investment portfolio across many kinds of businesses. The asset managers themselves are also diversified across different fund types and no single investment fund drives the business overall. The funds themselves are also very long duration, the clients’ money is contractually locked in, and the fees are often not based on fluctuating asset values but rather on the original amount contributed. Currently, though, I don’t think betting a lot more is prudent.
Lastly, the bet you are ultimately taking no matter how “internally diversified” a conglomerate is is that the guys running the company and allocating capital know how to do it well. If you own Berkshire Hathaway, for example, you’re still betting 100% on Buffett’s ability to allocate capital between businesses no matter how many businesses the parent company owns. It’s the same at Brookfield & KKR.
In terms of time horizon, my original plan is still to own both for years as they exhaust their market opportunity. The evidence that’s come in over the last 4 years mostly agrees with my original thesis on KKR.
I also pointed out how I already model slow times when valuing the businesses, as well as considerable write-downs in the troubled areas; yet the stock’s still cheap. The reason these problems should make for good risk/reward is that none of them kill the business’ core value proposition or business model, and the long-term runway is still there. If those weren’t true, the stock might look cheap to some people, but would likely not turn out to be cheap. Because the value proposition’s still intact going forward, the long-term market opportunity is still there in spite of short-term headwinds.
In all, that’s why I think there’s a lot ahead for these two, and it’s why/how I think BN is mispriced.6 For both companies, I don’t think I have any informational edge, nor do I think I have an insight no one else is aware of. Instead, right now the advantage is behavioral and time horizon. It’s not comfortable to own these stocks in a rising rate environment and into a recession when industry conditions are slow. Nor is it fun to watch Brookfield have to hand over the keys to a few office buildings while you’re bombarded with daily news of a new office defaulting somewhere in the industry. It doesn’t make for a great story.
But those times often make for great investments when you find the durable businesses that will navigate the problems and emerge stronger on the other side. In many ways Brookfield is the baby being thrown out with the bathwater.
As usual, if you’re enjoying our stuff, please be sure to Subscribe if you aren’t already.
And share! It goes a long way!
Chris
Disclaimer: not investment advice, guys. This is not investment advice. Also, I know way, way more about these companies than a 20 minute post contains. I’m sitting in front of a pair of 25 page reports and pages of notes, picking out the couple most important things, not to mention years of talking to people in this industry, listening to conferences and other calls, etc…
They usually take that percentage on all the profits once passed the hurdle rate, not just the amount of profits in excess of the hurdle.
Although one of the reasons for this is cheesy: stocks are marked to market every day, while alt. assets are usually marked quarterly, so the math just makes them less “volatile” although in many cases the actual risk isn’t lower. In many other cases, though, it is (such as in infrastructure assets, where the cash flows are often under multi-decade contracts with most of the revenue locked in).
Frankly, most clients look at the past to judge the manager’s future, even though that’s not the best way to do it. The best firms like the Yale endowment don’t do it strictly this way, but most institutions do. There’s also “social proof” and “career risk management”, where the lowest risk choice for any client CIO is to go with one of the established brands, since they’re the ones everyone else is going with.
https://www.cbre.com/insights/briefs/most-us-office-buildings-more-than-90-percent-leased#:~:text=While%20the%20overall%20U.S.%20office,to%20a%20recent%20CBRE%20Viewpoint. CBRE provides a lot of public information on its website about real estate, and is a commercial real estate brokerage. JLL is as well, and does the same. They’re good sources of more info.
I made several adjustments to get a “normalized” current earning power; for example, I adjusted the real estate and private equity businesses’ free cash flows downward after estimating what the impact of higher normalized interest rates would be on them.
KKR is too, but we didn’t have time to go through both in detail.