

We’ll do hard analysis on BN on its two biggest crown jewels: BAM and BWS, and which combined are >70% of BN’s intrinsic value. For KKR I’ll be narrative-oriented.
(Remember Brookfield entities report in USD. Dollars below are USD unless noted.)
BN — Dude, Where’s My Carry?
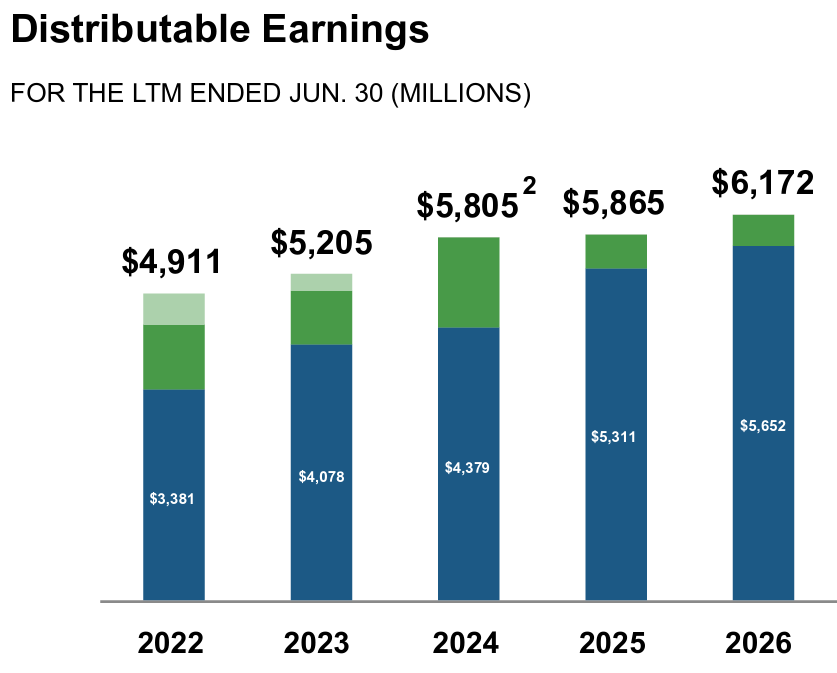
In the last 12 months, BN generated $6 billion “Distributable Earnings” or DE, a metric most peers in the industry use, and which closely approximates free cash flow as I define it.1
Recall we bought this business for about $50-55 billion in 2023. At the time, I pegged it’s ongoing normalized free cash flow at ~$4.3 billion and figured we’d get north of $8 billion in 5 years. We seem to be below that trajectory, but in the ballpark.2
The main culprit is net carried interest from realizations, which is the green bar below and was only $520 million most recent trailing-12-month period:
They decompose that here:
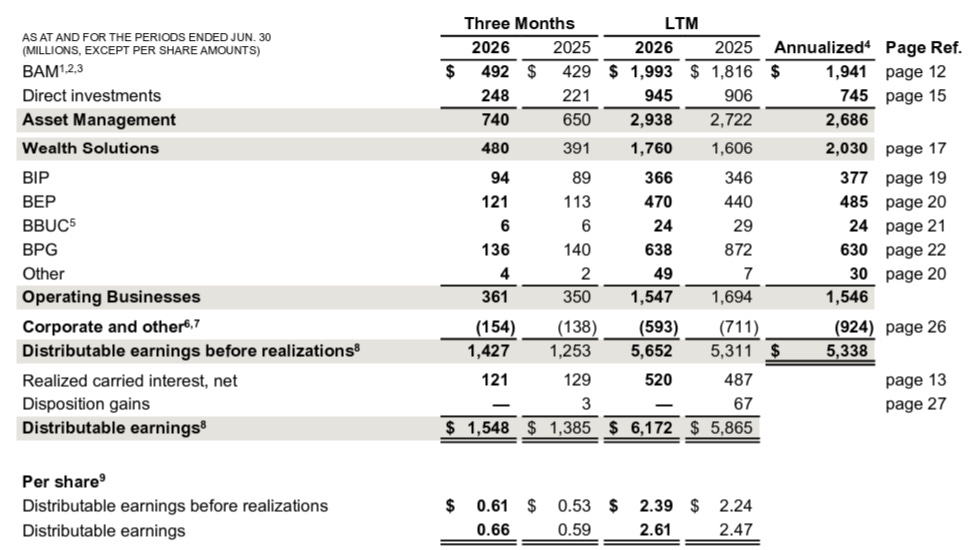
Remember carry is lumpy. It’s the share of profits they get when selling funds’ investments and returning capital & profits to clients. First, the clients get their initial investment back, then, e.g., in private equity, Brookfield takes 20% of the profits and the clients get 80%. Of the 20%, senior employees take 30%, and we shareholders take 70%, on which we then pay tax.
The “realization environment” for selling assets is OK today, but there’s a large backlog of stuff that needs to get sold across the industry, which other market participants need to absorb and other large companies needs to absorb, through IPOs, acquisitions & mergers, etc. That seems to be bearing out, since Brookfield realized only $520 million, but accrued $1.5 billion worth of unrealized carry as it its funds’ investments rose in value:
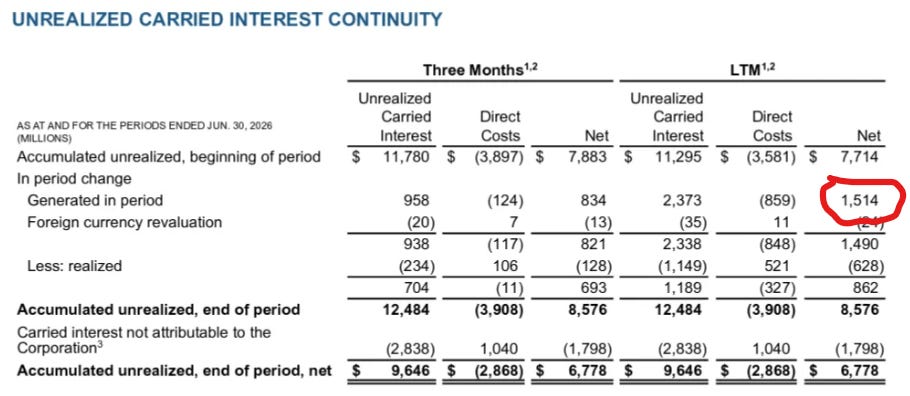
The way most of their funds work, we don’t get this number in cash until the fund is well on its way to completing liquidation.
(What I do in my modeling is I estimate carry accrued each year based on an investment performance assumption. Then I “lag” it 5 by years, meaning the 2025 accrual is the cash flow in 2030. The carry we get today is harvested from trees planted 5 years ago.)
You can math it like: they had $150 billion carry-eligible capital 5 years ago. A 15% return is $22.5b/yr. 20% of those profits is $4.5b carry. 70% is $3b. After 20% tax it’s $2.5b, so that’s what free cash flow we should see today, roughly.3
We also lose 17% of that money to the shares of BAM that BN no longer owns, through a somewhat-complicated agreement.
But still! $520 million is way off.
I estimated we’d be pushing ~$1.8 billion/yr carry by 2028, so this is the main reason earnings & growth are lagging our model, and perhaps partly why the market doesn’t want to pay the $70ish we think it should be worth.
This isn’t a structural issue. It’s a timing issue. I think we eventually get the money. We are just in a so-so place in the private markets monetization cycle. If the economy and capital markets remain strong the next 1-2 years, we’ll see this number accelerate. If we are headed for recession, this number will be delayed.
It would be structural if Brookfield was suddenly doing bad job investing, overpaying for crappy businesses, failing to improve them, and generating much poorer returns for clients. The evidence says they’ve stuck to their discipline and process. Eventually they will sell for profit the good assets they bought cheap and improved. So I am OK with this problem, think it’s temporary, and think the ~$70/share base-case stands.
Looking at it another way, the $45/share the stock trades at today doesn’t stand, given they can be doing $8 billion-ish or $3.40 per share in a couple years and will still be growing BAM 10-15%/yr at the time, while reinvesting all that cash flow at ~15% rates of return, such as into BWS at 15%.
BAM (Brookfield Asset Management):
Fee-paying AUM +19%, to $672 billion. 3 years ago it was $440 billion, so they’ve grown 15%/yr compounded, in line with our 2023 model (15%), though the fee revenue rate is compressing slightly and may continue to as products shift toward the wealth management channel and toward credit. Credit funds don’t capture the delicious 1-1.2% fees that private equity and infrastructure funds do. Still, we’re in the ballpark.
Notably, fundraising in real estate has been slow; competitors called this out too, as the sector remains out-of-favor (especially office & retail, where Brookfield plays) after COVID & the interest rate hiking cycle pressured landlords. It’s a sentiment problem. Credit is doing well. Infrastructure and private equity inflows seem slow but that’s because they’re fundraising the next vintage of flagship funds now, out there pitching clients.
Margins 57%, a tad low and should be ~60%+. It has been “a tad low” for a while now. I think Brookfield is still spending a lot within Oaktree and elsewhere, hiring people to build the sales/distribution relationships needed to sell its funds through retail channels, like bank-based investment advisors.
Carry was low, as we said.
BWS (Brookfield Wealth Solutions, the annuities & pensions):
BWS hit their target of doing $2 billion a year free cash flow.
Total assets hit $190 billion, from $134 billion 12 months ago (+41%). Nearly all of the +$56 billion is the acquisition of Just Group (“Just”), which sells annuities (~25%) but mostly buys pensions (~75%), such as from a big company that wants to offload the risk and administrative burden of their defined-benefit plan.
I estimate BN invested another $5 billion of our money last-12 months to get here, driven mainly by >$3 billion for Just.
So, we are making $2 billion on $15 billion invested, a so-so 13% return.
However, Just is a fixer-upper. Since it is ~25% of BWS’ assets now, it’s dragging down the total we see. Sachin Shah, an excellent Brookfield executive who now runs BWS, pointed out Just’s cost structure is triple what they model a good competitor can do here. Shah is getting to work fixing Just.
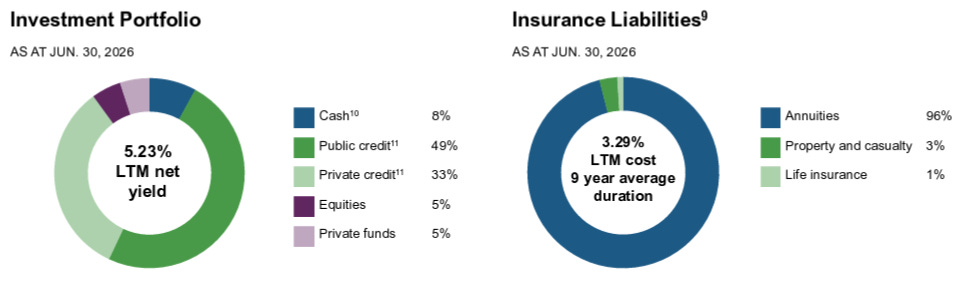
Second, like the acquisitions BWS did before,4 Just doesn’t own any Brookfield credit & other funds, which perform better than the public markets bonds it owns for similar risk. Brookfield will rotate Just’s portfolio into these assets, increasing the “spread” it earns between the cost of annuity and pension payouts vs. the investment income the assets make. You can see that in these charts:

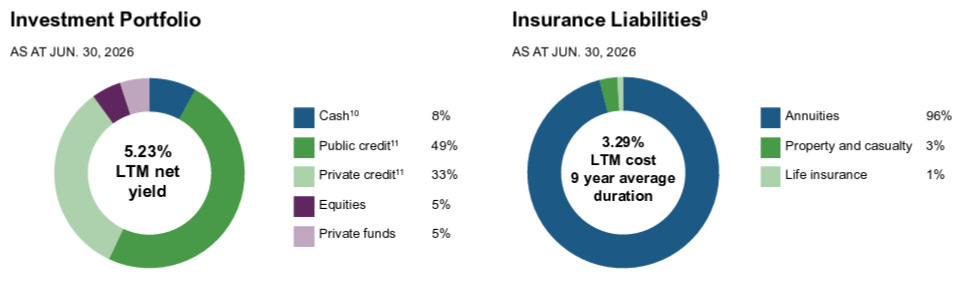
Note the big performance gap: excluding Just, BWS earned 5.74% on its investments. Including, it earned 5.23%, a 0.51ppt gap. In a business where your goal is to make a 2%+ spread, 0.5ppts is a quarter of your gross profits. This is an easy fix: as Just’s bonds mature or are sold, Sachin Shah rotates the money into Brookfield credit funds and loans.
These two levers, cost reductions and portfolio rebalancing at Just Group, will push BWS back to 15%+ returns on capital, and our $5 billion will look well-spent.
Finally, note BWS’s balance sheet progress toward ~40% private credit. It’s 33% vs. 26% last quarter, despite the Just Group acquisition dragging this % backward. This will continue pushing BWS’s overall spread upward, too, since private credit loans have similar risk characteristics to public bonds & loans, but carry higher yields due to their illiquidity. An annuity insurer focusing on pensions can take liquidity risk, because many defined-benefit pensions have no “surrender risk” (like annuities can) which makes these assets and liabilities a good match. Footnote5 for full explanation.

Capital allocation:
Real estate: I don’t run the company and can’t change this, but I still think their balance sheet position is suboptimal and that they should be moving faster to reduce real estate exposure, and redeploying the capital into private equity, power, and infrastructure opportunities where the risks are not much more but the profitability is substantially higher. This said, they have a house view on office real estate and believe they’re going to be collecting substantially higher rents at their core properties, so.6
KKR
AUM: $796b, +16% y/y. Of which $636b is fee-paying AUM (FPAUM) currently, +15% y/y. Excluding an acquisition that brought in $10.0b FPAUM, organic growth was decent, at +13% y/y.
Fee-rates: will move toward ~0.90% from ~1.0% historically, as new inflows show the mix of business is shifting toward private credit funds where fees are lower.
Fee margin: 70%. I think will probably be around 70%ish or high 60%s for a while with potential to rise, depending on the hiring rate in Wealth. Revenue’s growing faster than headcount & wage growth, so they’re running above the “leverage point” basically.
Looking back on our investment: I want to illustrate the business’ performance & the power of long-term compounding. In 4Q 2022, we doubled the position from ~5% to ~10% of the portfolio at ~$45-55 per share, believing it would be earning $7 per share in a couple years. FPAUM was $412b in 4Q 2022, and so the business is >50% larger now and has compounded its client footprint at 13%/yr. Even better, I pulled out my original Winter 2019/2020 report, back when they had $133 billion in FPAUM:
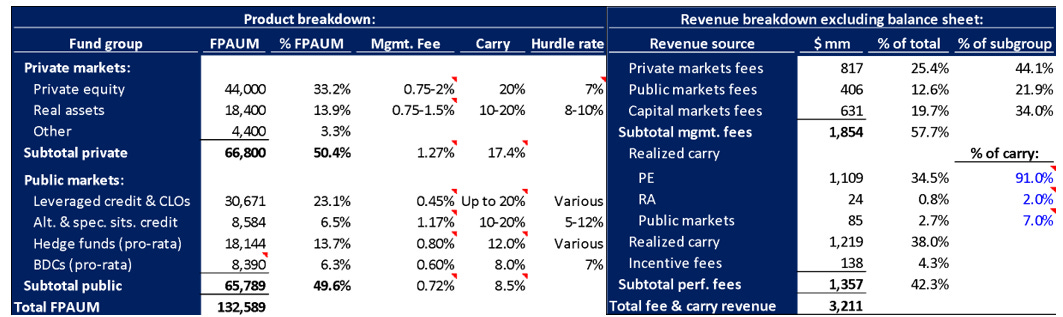
Our company’s asset management business is now 4.8x the size it was 6.5 years ago. Say 5x over 7 years, to make the math simple. So, FPAUM has grown 26%/yr. That’s through COVID, through an inflation spike, and through the Federal Reserve’s subsequent record-pace interest rate hiking cycle that put a damper on the economy by 2023. (There were a couple step-ups in FPAUM over this period, such as the Global Atlantic acquisition.. but still.)
Moreover, consider KKR just hit 50 years old. It’s probable that if/as we hold it for another 3 years, it will have compounded FPAUM ~20%/yr. What other half-century-old, “mature” company do you know that is achieving this? Maybe only Microsoft: Bill Gates and Paul Allen founded it in 1975. In the last 5 and 10 years it has grown revenue 14.5%/yr and 13.8%/yr, respectively. Mastercard was founded 1966, and has done 12.5% and 13.1% the last 5 and 10 years, respectively. Google and Amazon are not old enough. I’m struggling to find others producing this kind of organic growth, at this scale, and at this stage of corporate and industry maturity. The world is full of entrepreneurs trying to grow young software companies at these rates, but many of those aren’t very profitable as they spend heavily on customer acquisition. Meanwhile our company has 70% pre-tax margins on its fee base even as it invests in salespeople to grow its Wealth business.
There are few companies on Earth with economic characteristics this good.
The power of cross-selling: One last thing. It’s tough to convince people to buy what you’re selling. This is why founding a new business is incredibly hard. But cross-selling, a new product to an existing customer base? Oh boy, that is a gift. Why? You already own the customer relationship and the trust. So, if there’s something they’d probably buy from you if you made it well, because they already trust you, like you, and do business with you, it’s easy to sell it to them.
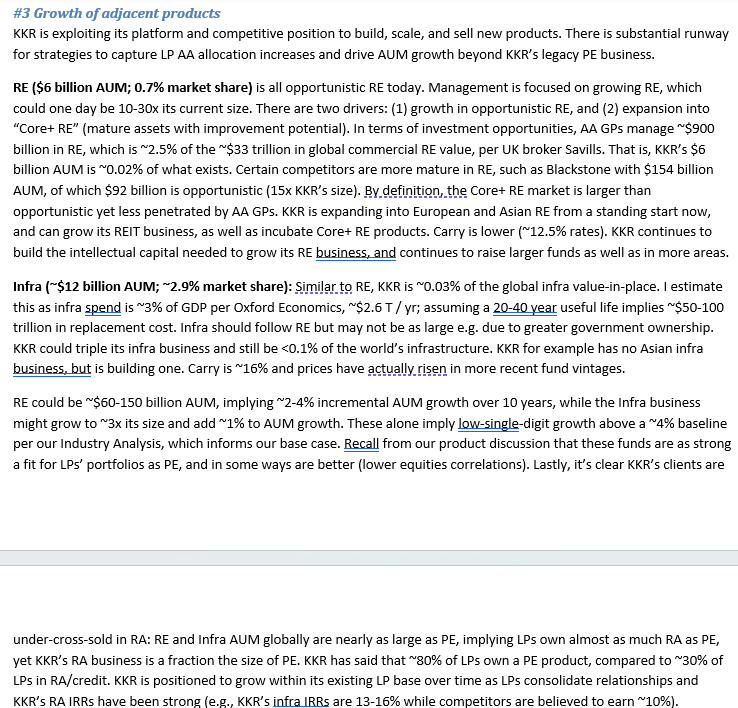
KKR illustrates this well. Back in 2019, Real Assets (infrastructure + real estate) funds FPAUM was ~$18 billion, and they’d only done 2-3 fund vintages at the time. The first Infrastructure fund, they had to discount the fee rates, and funded ~30% of the fund AUM off their own balance sheet to show investors they had skin in the game. Even then, it was small. But, their salespeople already had nearly 2,000 relationships with institutional investors who had been buying their private equity funds for 40 years, and private credit funds for almost 20. Real Assets fund performance was good across the first 2-3 funds. It also has low correlation to stocks, bonds, and private equity, and clients didn’t own a lot of Infrastructure at the time. So, it was an easy sell: they already had the reputation and client trust, they already had the big client network, and they already had the demonstrable product-market fit from the first couple funds’ performance characteristics. So, all they had to do was put the product on the shelf and tell everyone about it.
Clients bought. Today, the real assets fund business’ FPAUM is $175 billion, 10x the size it was when we first bought KKR stock.
Every now and then I have good ideas, and I saw that one. Our 2019 report:
There’s always more to say, like what performance in the new wealth / investment advisor channel is like (good), or how they’ve grown to become the largest infrastructure & private equity investor in Asia, or how Global Atlantic is expanding to Japan successfully, etc., but… I’ll leave it here.
— Chris
Excess cash which can be extracted from the business or used to reinvest, without harming the business’ future earning power.
Lower if there’s a steep recession within the next 2 years, higher if Brookfield goes through an excellent environment for selling assets next 3 years.
In reality the carry rate is a tad lower, the employees’ take is a tad higher, and the average return is lower.
American National and American Equity
Beneficiaries already receiving payments can’t ask for an early, lump-sum payout. Payments follow a formulaic schedule until the pensioner passes away, which makes them perfect liabilities to match against higher-earning, but illiquid, assets. This, e.g., is why the Canada Pension Plan mainly owns private assets today. You take a payment from a working Canadian at age 30, and you put it into a toll road or a nuclear power plant with very stable, contracted, inflation-indexed revenue & profit profile, and you hold it for 30 years, and begin paying them out that profit profile to the retired Canadians, with no risk that the working and retired Canadian population can come to you and ask for all the money back right now (meaning you have to fire-sale all your toll roads and power plants). These assets and liabilities are made for each other.
Real estate is their worst-performing asset class long-term, mostly due to the characteristics of those assets (commodity) and the market structure (efficient, many buyers & sellers, limited differentiation). By contrast, they have a lot more opportunity for value-add in the asset classes I listed above.